To create a real forex account for free, click here
Traders interested in the technical analysis must have come across chart patterns or even used them in trading. However, there are less known, but far more accurate patterns that could project future price movement in any timeframe.
This overview deals with harmonic patterns in trading. Here, not only geometric features but also the measurement of particular legs of the pattern. Read on and you will learn how harmonic patterns are built, and how they differ. The article also describes the types of trading signals provided by harmonic patterns and the rules to trade these formations successfully.
The article covers the following subjects:
- What are harmonic patterns and how do they work?
- General guidelines on Harmonic Patterns
- Types of Harmonic Patterns
- How to draw harmonic patterns
- Signals of harmonic patterns
- Harmonic pattern success rate
- Bat harmonic pattern
- Shark Harmonic Pattern
- Crab harmonic pattern
- Butterfly harmonic pattern
- Gartley harmonic pattern
- Harmonic patterns advantages and disadvantages
- Harmonic pattern indicators
- Harmonic patterns EA
- How to trade harmonic patterns – beginners guide
- Example of harmonic trading in Forex market
- Trading Harmonic Patterns: Summary
What are harmonic patterns and how do they work?
Harmonic patterns are based on geometric patterns, but they also apply Fibonacci proportions to determine pivot points more accurately. Many outstanding minds worked on their theoretical basis of harmonic patterns. Harold Gartley laid out the idea of the Gartley five-point pattern in his book Profits in the Stock Market, and Larry Pesavento established the basic rules for trading using Fibonacci levels. Scott Carney expanded on the theory of harmonic patterns by adding the Crab, the Shark, and the Bat.
Harmonic patterns are structures that combine graphic and mathematical components. They are considered one of the most accurate technical analysis tools, as they allow traders to predict the future price movement direction and the potential trend targets.
Also, unlike many other technical tools, the number of false signals generated by harmonic patterns is less. This is because harmonic patterns must develop in the correct proportions in addition to certain geometric features.
Harmonic and graphic patterns can overlap each other to form composite harmonic patterns. Therefore, studying the market in different timeframes often allows one to see signals that complement each other and delve deeper into market processes.
General guidelines on Harmonic Patterns
Here are some basic rules for those who have never read about harmonic patterns before:
1. Any harmonic pattern relies on the key Fibonacci retracement levels.
2. Harmonic patterns apply to all time frames.
3. The most popular pattern is XABCD, where:
- (XA) is a move, where point (X) is the start of the trend and (A) is its top;
- (AB) is trend retracement, and (B) marks the retracement extreme;
- (BC) is trend extension with the peak at point (С);
- (CD) ending move, opposite line (AB).
This type of harmonic pattern will be explored in this article. You can read about the AB=CD harmonic pattern in this article.
The XABCD pattern looks like this:
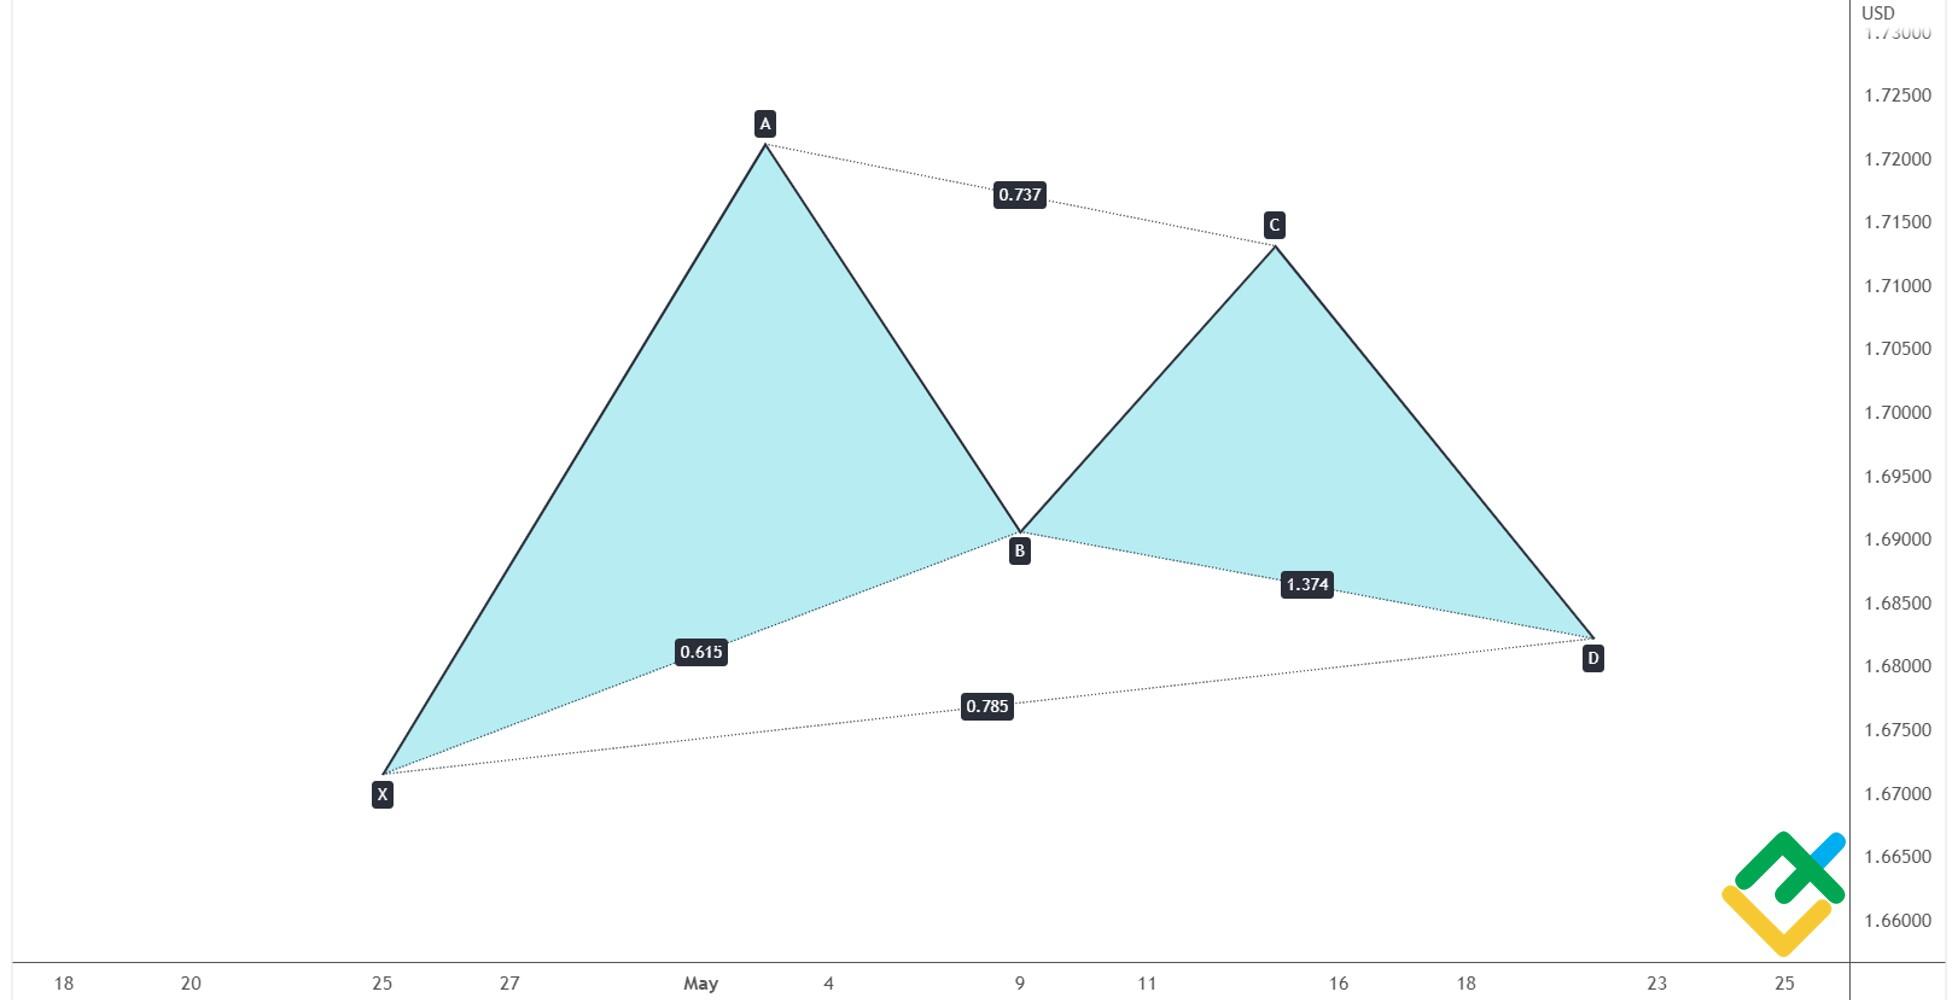
4. To start working with a pattern, it’s necessary to know the coordinates of points (X), (A), (B), and (С) in the history of a chart.
Only with these 4 coordinates at hand, you will be able to define a pattern type and its peculiarities.
Types of Harmonic Patterns
There are many different harmonic patterns: Gartley, Shark, Crab, Butterfly. All of them are visually very similar and it is difficult to see the difference between them at first. Harmonic patterns, as well as all chart patterns, can be conditionally divided into two types: bearish and bullish. To make it easier to understand their fundamental differences, check out the table below.
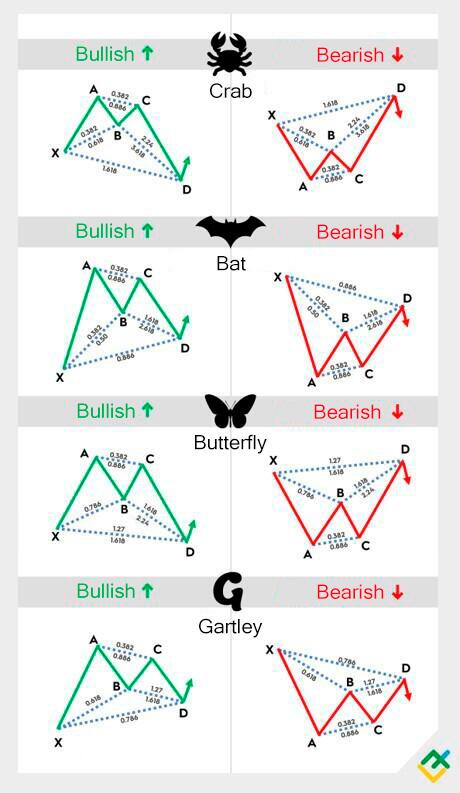
As you can see from the illustrations above, all harmonic patterns have a very similar wave structure, and the points are labelled with letters XABCD, where A and C always mark the local extremes of the pattern. It is important to remember that for a bullish harmonic pattern, tops A and C must look up, and for a bearish pattern, A and C are the base of local lows and look strictly down.
Another important feature of harmonic patterns is that they follow strict proportions of impulses in the XABCD wave structure.
Thus, to identify a specific harmonic pattern, it is necessary to determine the direction of peaks A and C. At the same time the pattern points should meet the following criteria:
| Pattern type | B of XA | C of BA | D of AB | D of XA |
| Gartley | 0.618 | 0.382-0.886 | 1.272-1.618 | 0.786 |
| Bat | 0.382-0.5 | 0.382-0.886 | 1.618-2.618 | 0.886 |
| Alternative Bat | 0.382 | 0.382-0.886 | 2.0-3.618 | 1.13 |
| Butterfly | 0.786 | 0.382-0.886 | 1.618-2.24 | 1.272 |
| Crab | 0.382-0.618 | 0.382-0.886 | 2.24-3.618 | 1.618 |
| Deep crab | 0.886 | 0.382-0.886 | 2.0-3.618 | 1.618 |
| Shark | 0.382-0.618 | 1.13-1.618 | 1.618-2.24 | 0.886-1.13 |
The table specifies Fibonacci levels of respective directional movements.
The pattern parameters should be strictly observed. Any deviation lowers the performance of the objectives you’ve set (it’s advisable that deviation from the levels above should not exceed 0.05).
How to draw harmonic patterns
As mentioned above, most harmonic patterns are based on four price impulses with points X, A, B, C, and D. The construction of almost all patterns comes down to the algorithm covered below.
First of all, you need to spot a double top or double bottom candlestick in the chart. This serves as the basis for analysing the chart to spot a harmonic pattern.
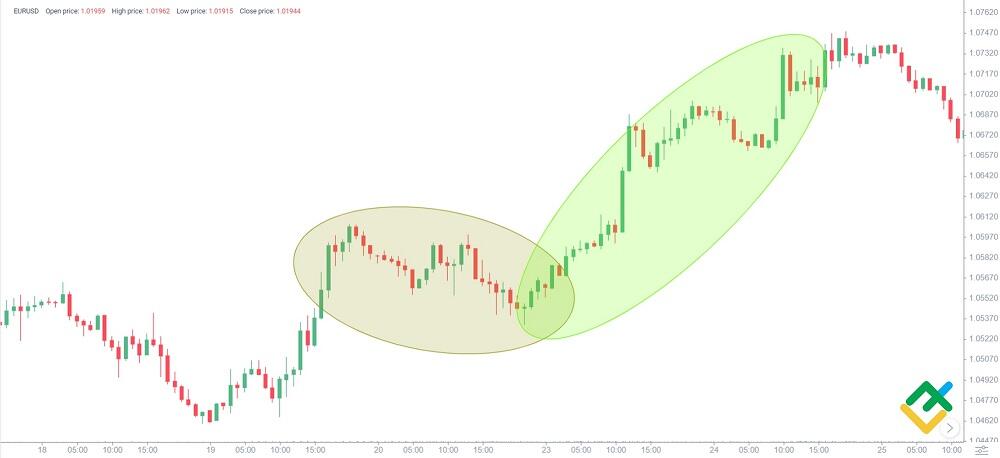
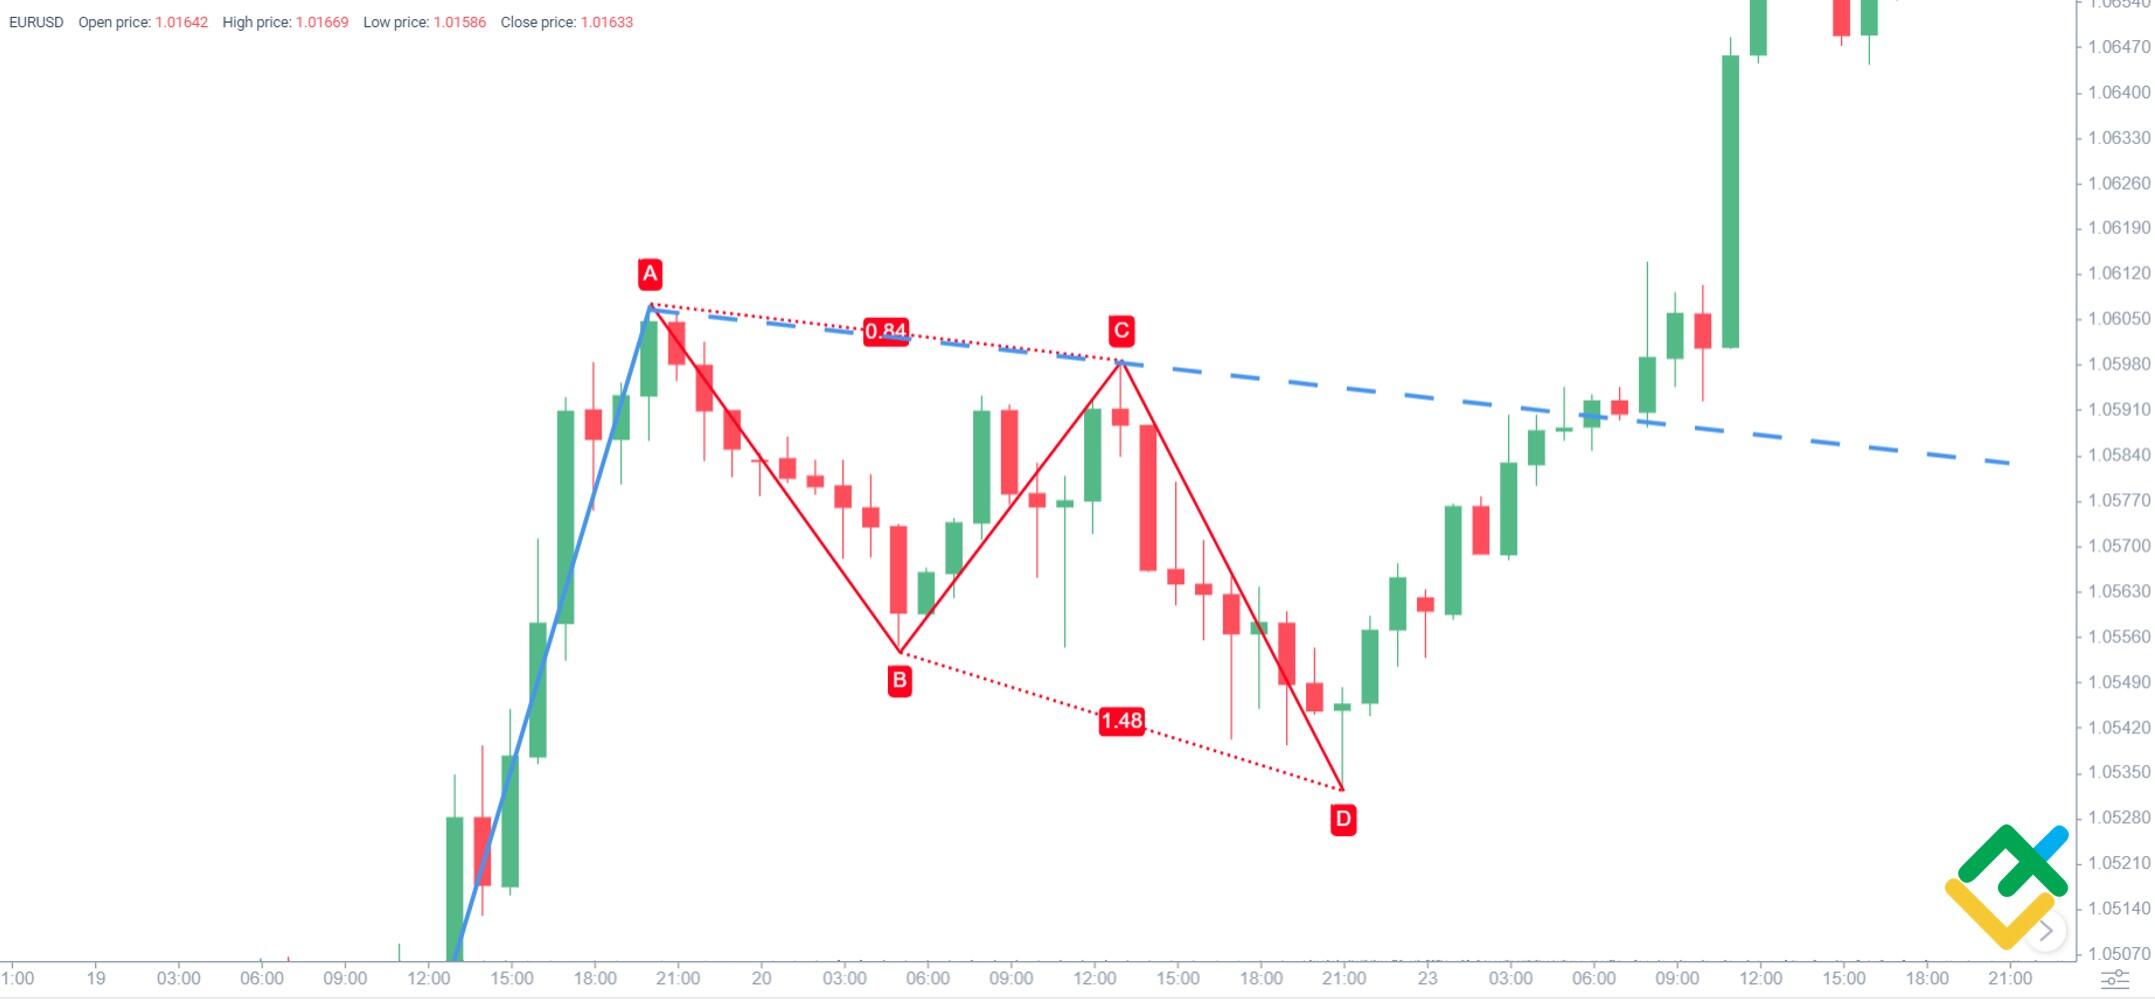
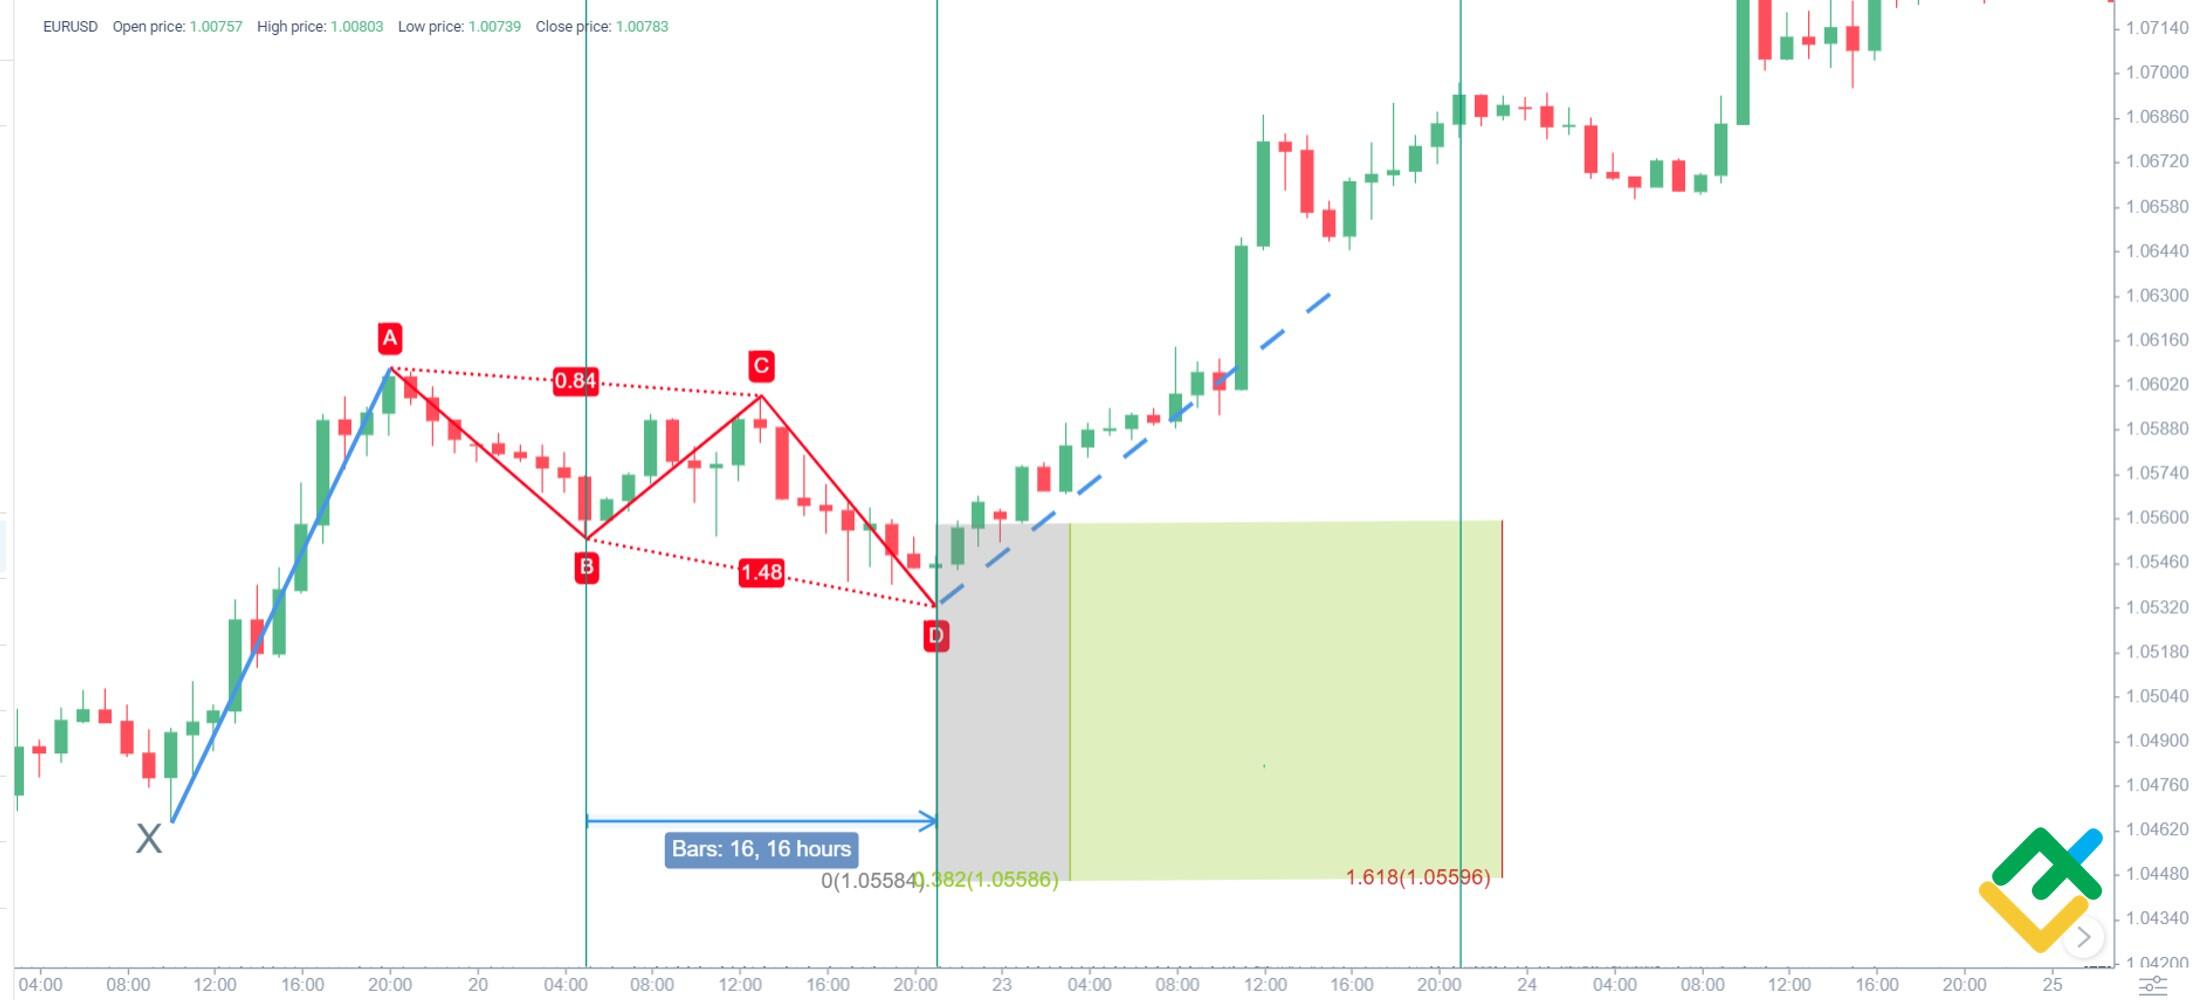
You can see a classical example of a harmonic pattern in the EURUSD trading history. We see that a strong uptrend follows a sideways movement marked with a brown circle. Let me explain step by step how one can define the impulse direction (green circle) and the targets for it.
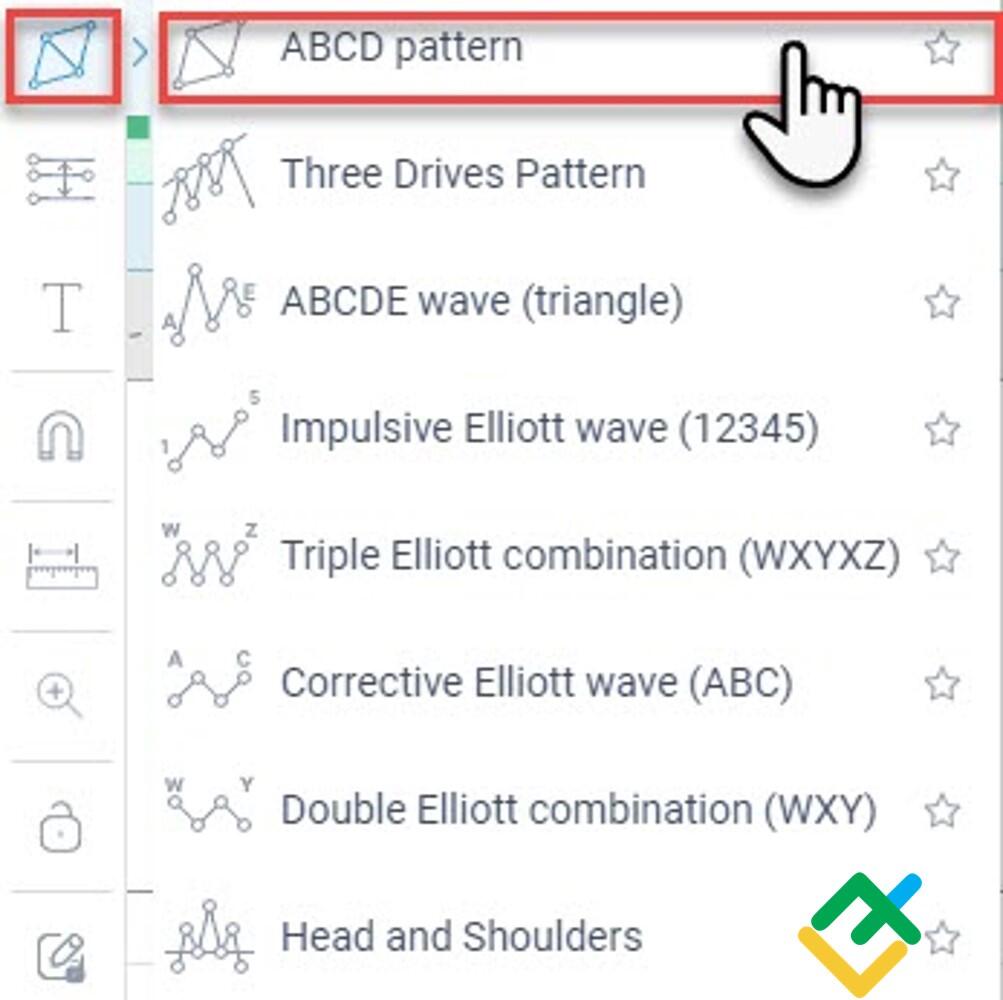
To identify a harmonic pattern, you need a special tool, called the ABCD pattern in the LiteFinance online terminal.
If you trade in MetaTrader, I recommend setting a harmonic pattern indicator, for example, Shepherd Harmonic Pattern.
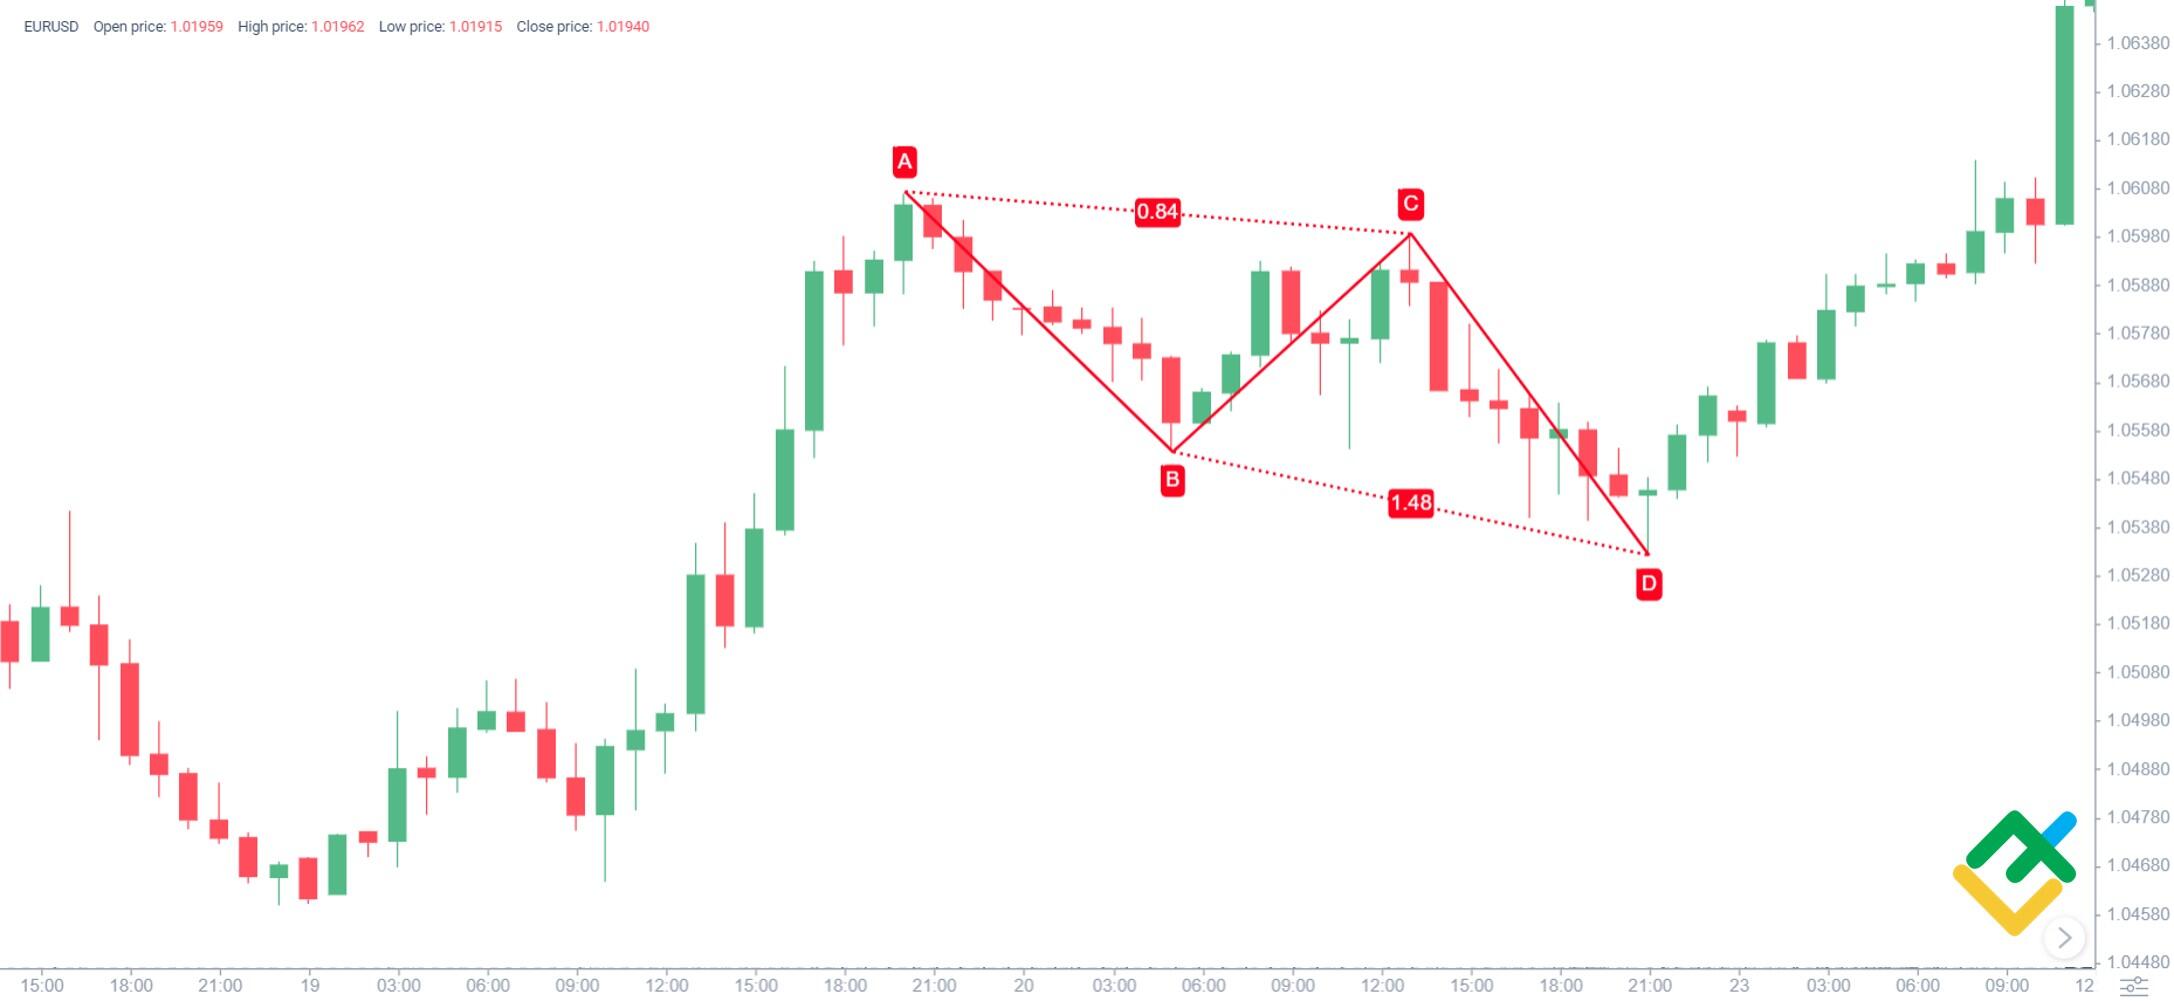
Next, put the points of the ABCD pattern so that the A and C points fall on the local highs.
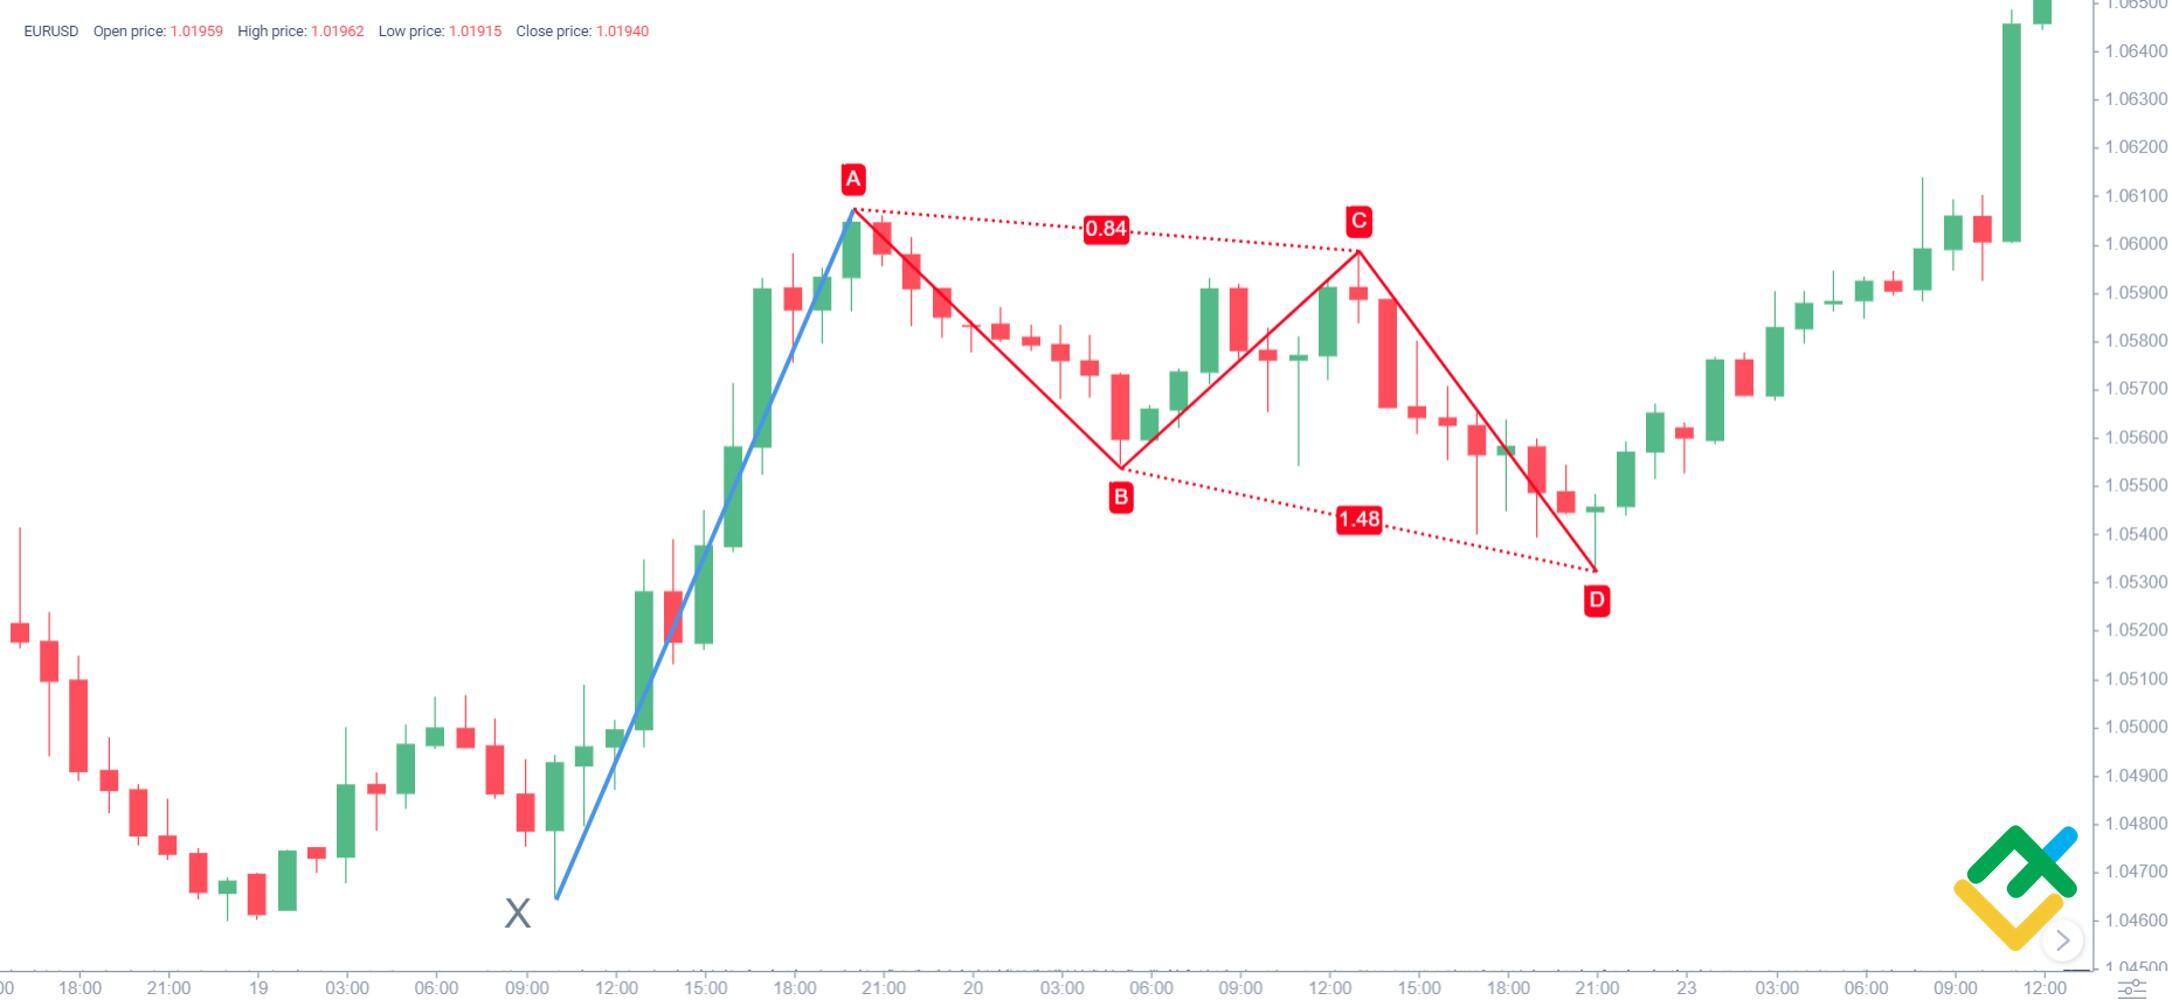
Now let’s define point X. It should be at the bottom of wave XA, which should be located in the same direction as the highs A and C. An important feature of wave XA is that it is always longer than wave AB.
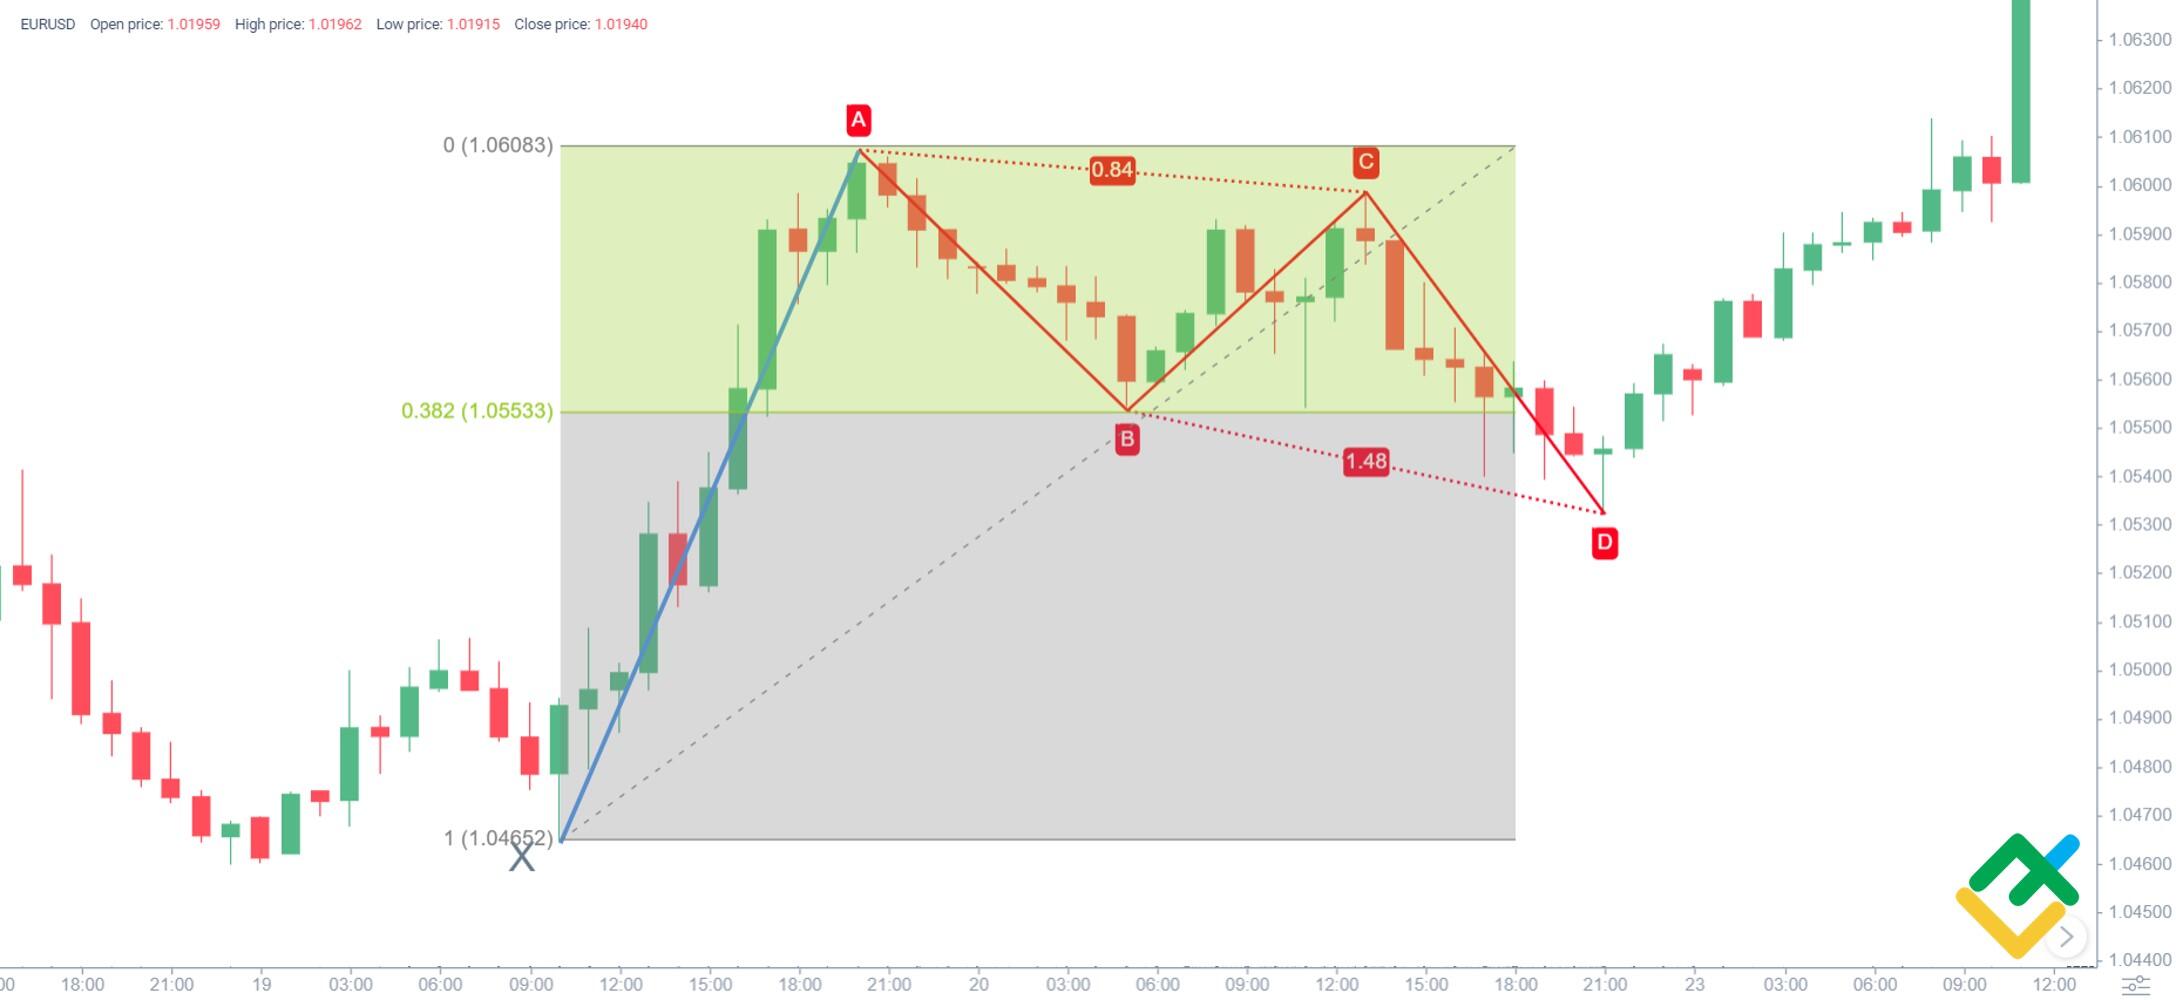
Next, we check the proportion of waves within the pattern. This is where the Fibonacci grid comes in handy. We see in the above chart: wave AB reaches exactly 0.382 Fibo of wave XA. This value already narrows down the range of possible patterns. If we return to the table above, in column B of XA, we see that only Bat (or its alternative), Crab and Shark correspond to this value. Therefore, we will consider the proportions of other waves only relative to the above patterns.
In the above chart, we also see that top C is at 0.84 Fibonacci level of wave AB. If we check this value according to the table above, we will see that only Bat (or its alternative) and Crab correspond to this parameter. This parameter is not suitable for the Shark, so this pattern can be ruled out.
It is important to note that if the value obtained at this stage would go beyond the limits described in the table, one of the harmonic patterns will be unlikely to form. However, in our example, everything is fine, and already here, we can assume the location of point D. In other words, based on the first two points, it is already possible to predict the size of the pullback and make trading decisions.
If the correction at this step has not yet formed, then we can build a projection of the supposed point. In our case, when the extreme of point D is already known, we measure the distance in pips and mark it, in fact, at the lowest point of the CD correction wave.
Signals of harmonic patterns
When you have defined a pattern type, you need to determine four key zones to define entry points. Next, when the positions are opened, you need to consider the angle of ascent/descent and time zones. Let’s look at each component in detail:
Potential Reversal Zone (PRZ)
Any pattern has a start and an endpoint. What characterizes a truly harmonic pattern is quite a clear indication of a potential pattern ending point. Since a harmonic pattern is represented by reversal patterns, a finial pattern point is usually called Potential Reversal Zone. This level is determined by the use of Fibonacci levels in the framework limited by the pattern under analysis (for the framework, please see the table).
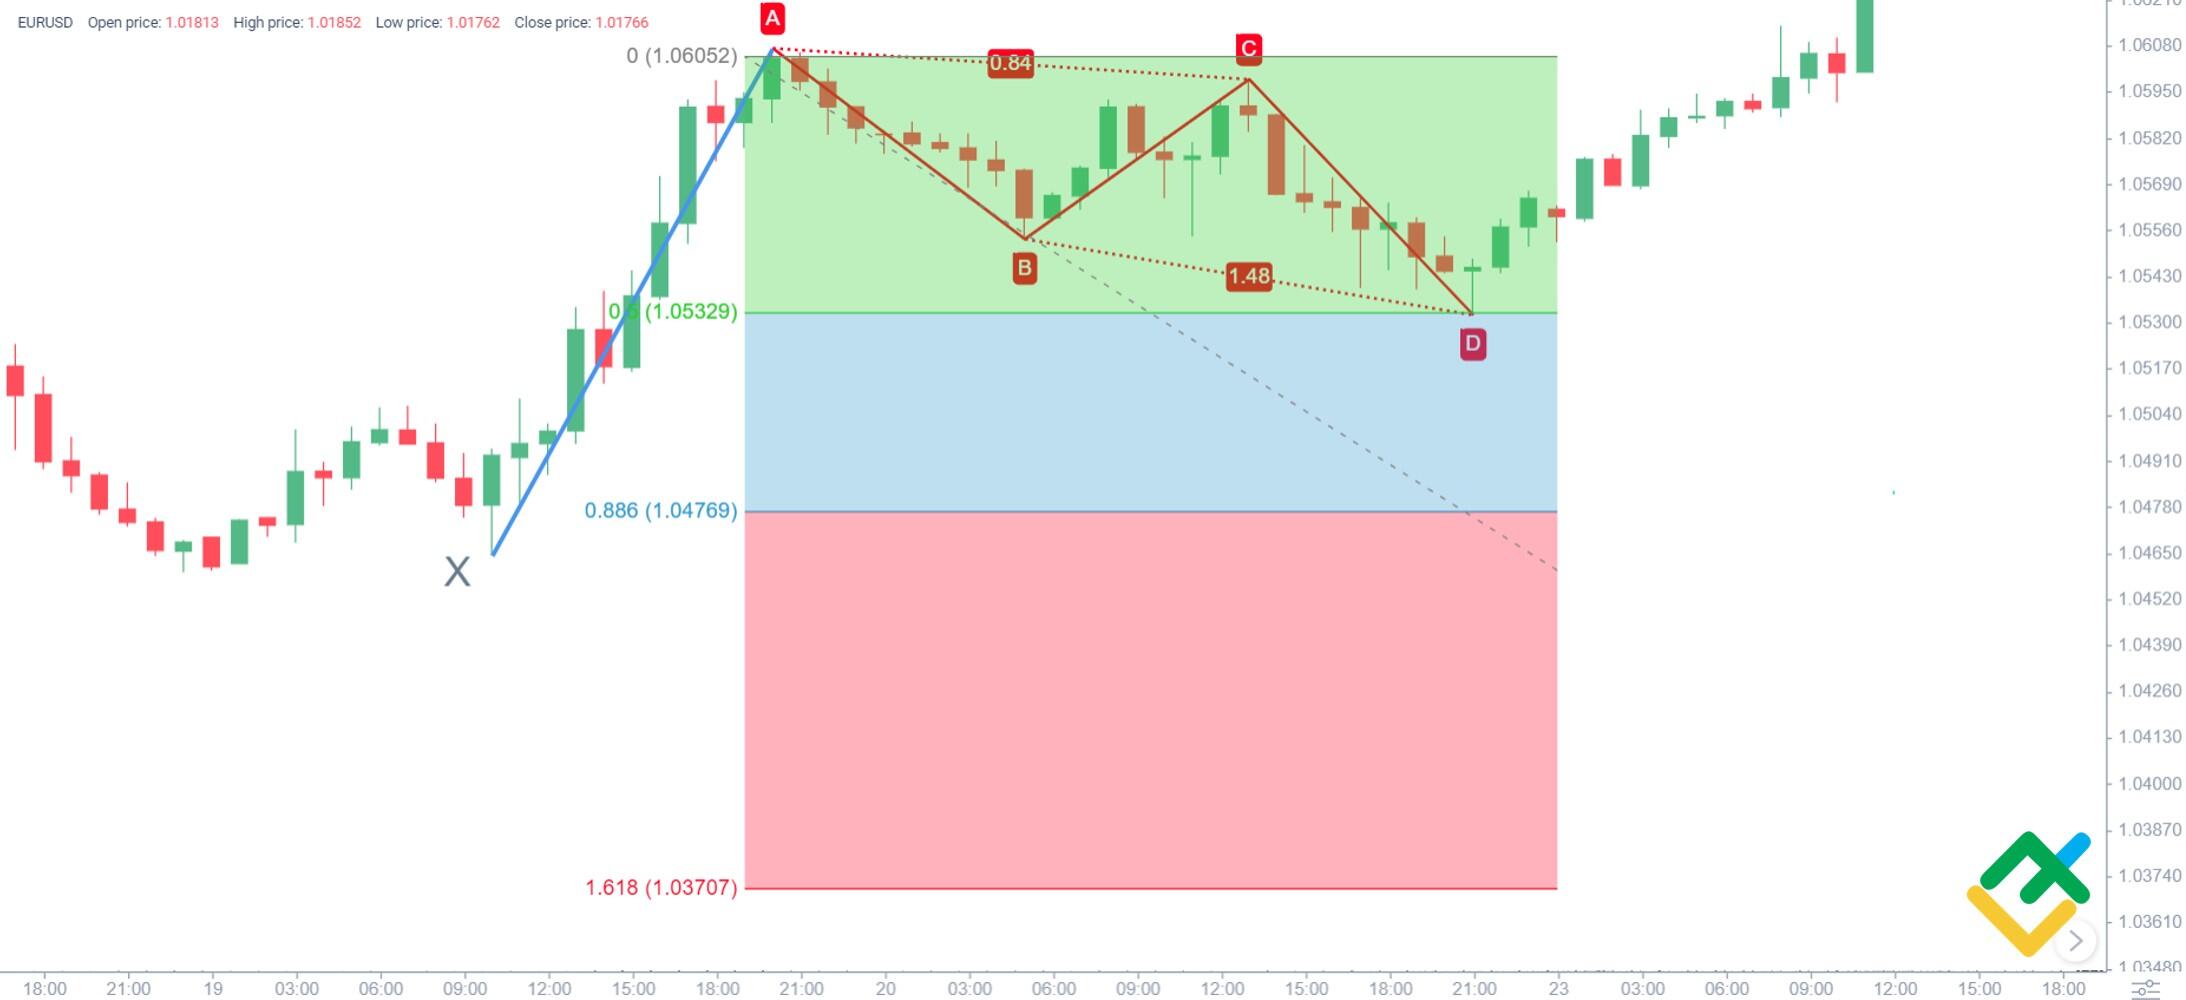
If we go back to the example explored above, the projection of the D point should fall into the PRZ, marked red in the chart. The zone boundaries (support and resistance levels) are determined by the parameters of the proposed patterns. In our case, these are Bat and Crab. Therefore, the upper limit of PRZ is 0.886 of D of wave XA for the Bat, and the lower limit of 1.618 for the Crab.
The price’s behaviour on this level is a crucial factor. If the price does not react to the PRZ, this indicates the current movement’s high potential and questions the consistency of the whole pattern. The converse statement is also valid, as in our case. If point D does not reach the PRZ, then most likely, the reversal impulse wave targets are above the expected targets.
Stop Loss Zone (SLZ)

The most important part of risk management is the definition of an acceptable loss level. In harmonic trading, this zone lies beyond the Potential Reversal Zone. This point makes it obvious that the pattern has not been validated, and it’s necessary to limit losses, revise the forecast, and correct mistakes. In the above chart, this zone is below the horizontal dotted line.
Profit Protection Zone (PPZ)
The most important trading rule says that:
“You should never allow your profit to turn into losses”
Based on this rule, before entering the market, you need to define the Profit Protection Zone – the level at which you will fix a part of profits to ensure a breakeven result in case the trend reverses and reaches the Stop Loss Zone. In the above chart, this zone is between the blue dotted line and the level of the D point.
Initial Profit Objective (IPO)
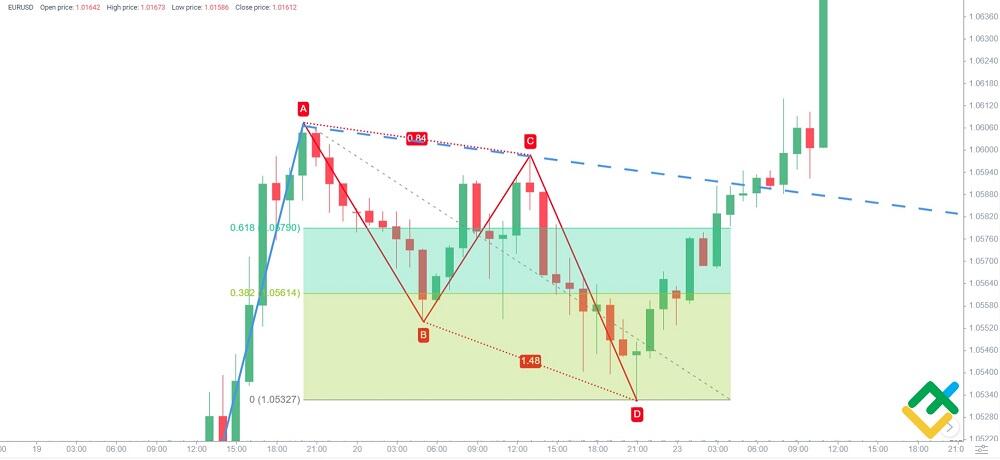
It’s very important to determine a position coverage point regardless of a trading strategy. Harmonic trading implies that the Initial Profit Objective is at 38.2 and 61.8% of the pattern base. If the price has reached this level but is not able to cover it, a part of the profits should be taken. According to some traders’ observations, if they have entered the market at a reversal point, with all necessary signals observed, a level of 61.8% of the pattern’s base will be reached with a higher probability. That is why this point is often chosen as a breakeven point too.
In the above chart, these levels are marked by the Fibonacci grid at the border between the light green and yellow-green areas.
Once you have entered a trade, the following should be considered:
Angle of Ascent/Descent
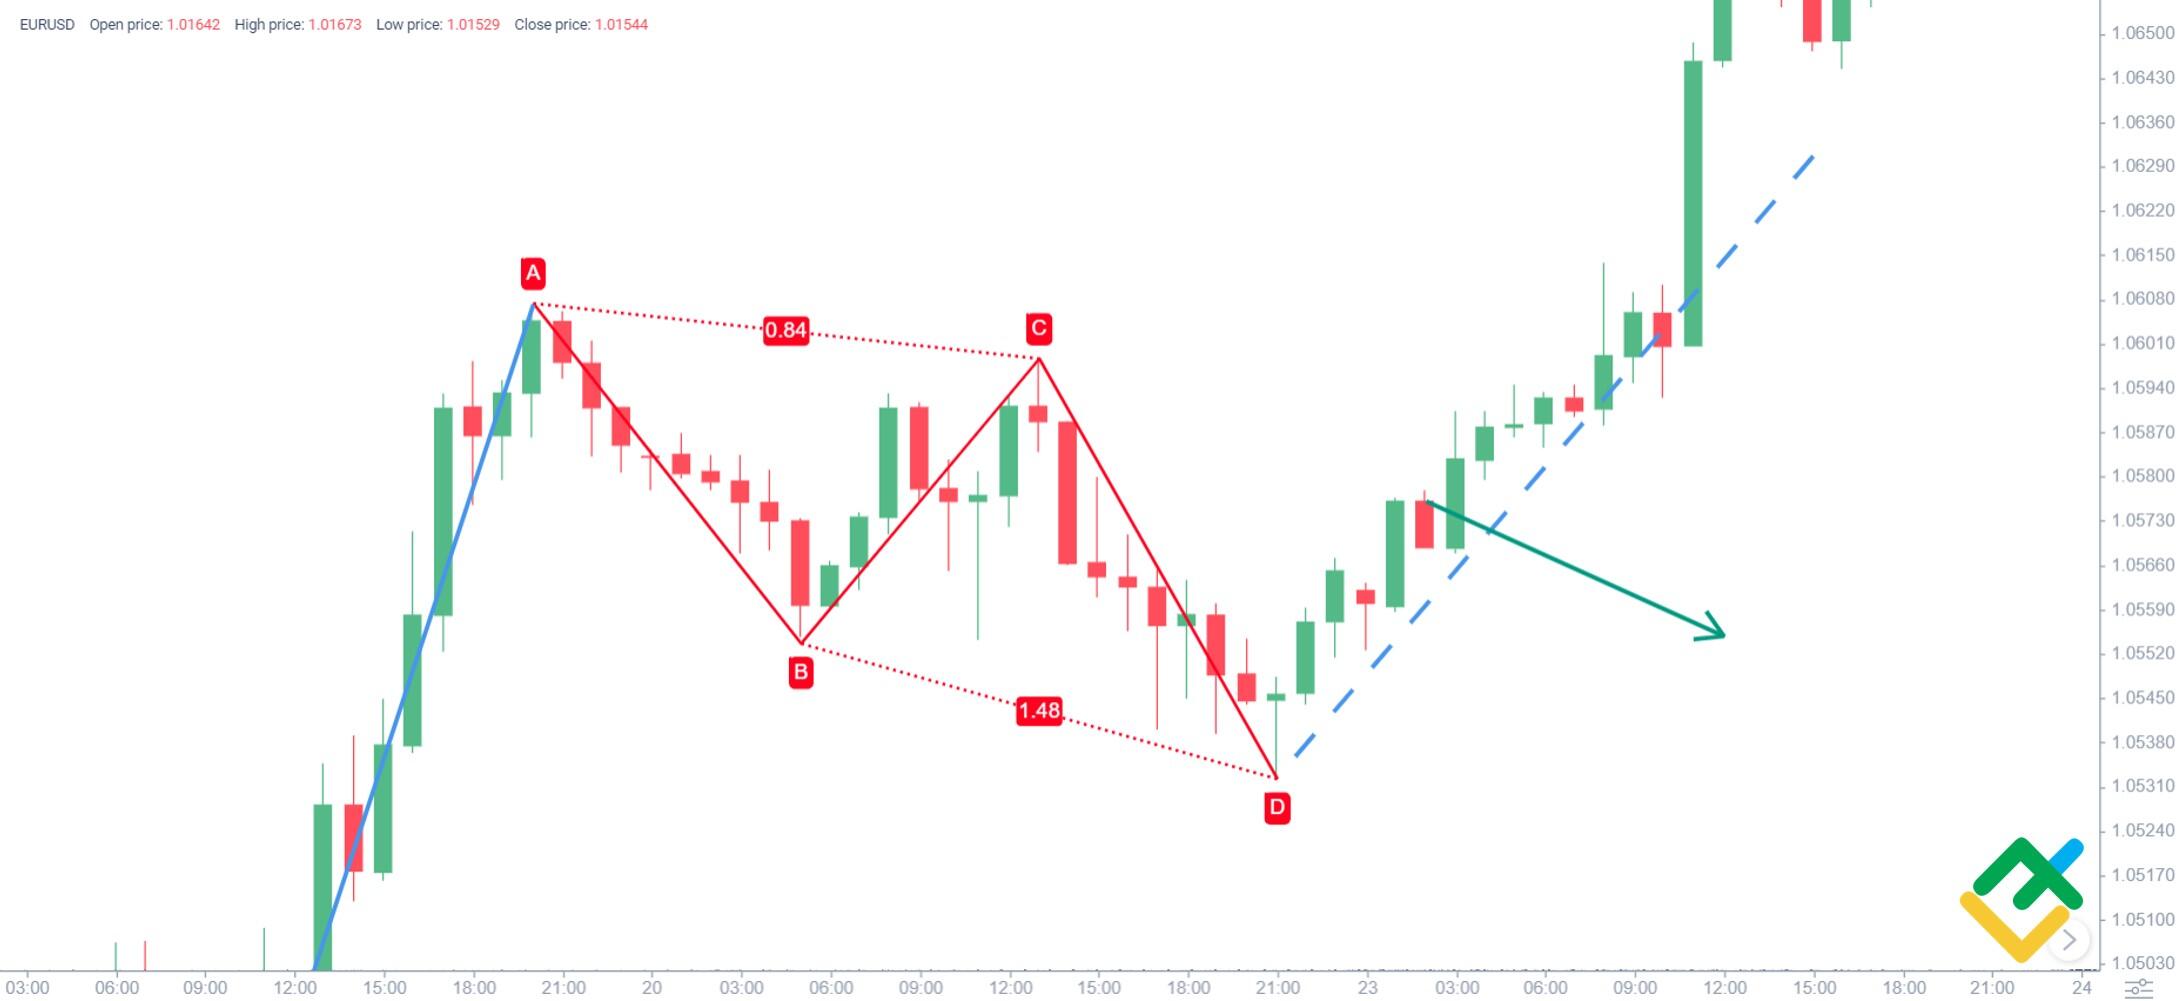
Though harmonic trading does not specify the price movement’s tilt angle in the reversal zone, if the market goes beyond the trend and turns flat instead of making an impulse, this suggests a revision of forecasts and trade targets.
In the above chart, the pivot wave trend is marked by the blue dotted line. You see that the price is following the trend. However, in case of a trend breakout, a sideways trend, or a price drop, as marked by the green arrow, there would be an exit signal.
Time Zone
As you already know, all harmonic trading patterns are based on Fibonacci numbers. This rule concerns not only price levels, but time frames too.
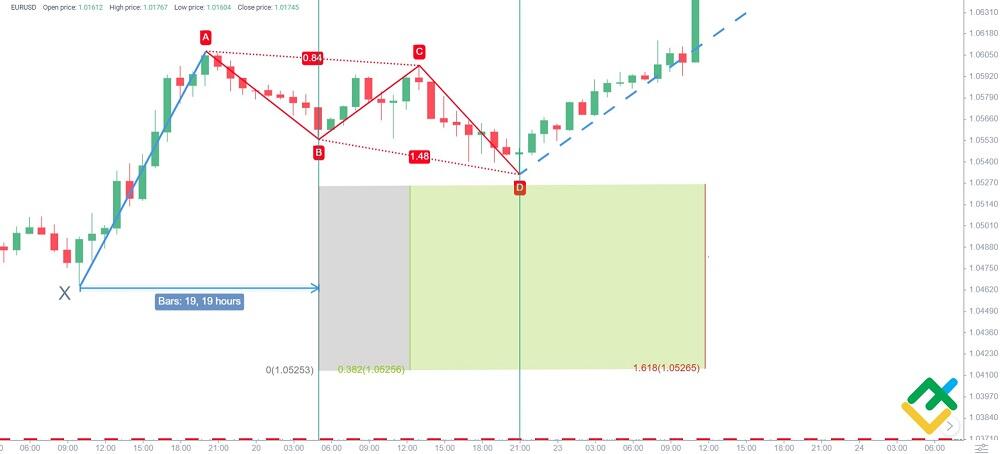
An ideal harmonic pattern implies that the time frames of the left XB wing’s formation and the right BD wing’s occurrence must coincide. However, this proportion is rarely observed, that is why, in order to check a pattern for validity, a framework is marked out where the BD distance is equal to 0.382 -1.618 of the XB distance.
In the above chart, this zone is marked green. It is clear that the D point is in the zone.
The same rule applies to a trend movement after the Potential Reversal Zone.
The length of this movement, whose impulse started at point D, is included in the time zone of 0.382 – 1.618 of the BD segment.
You see from our example that the impulse reversal wave falls into this period.
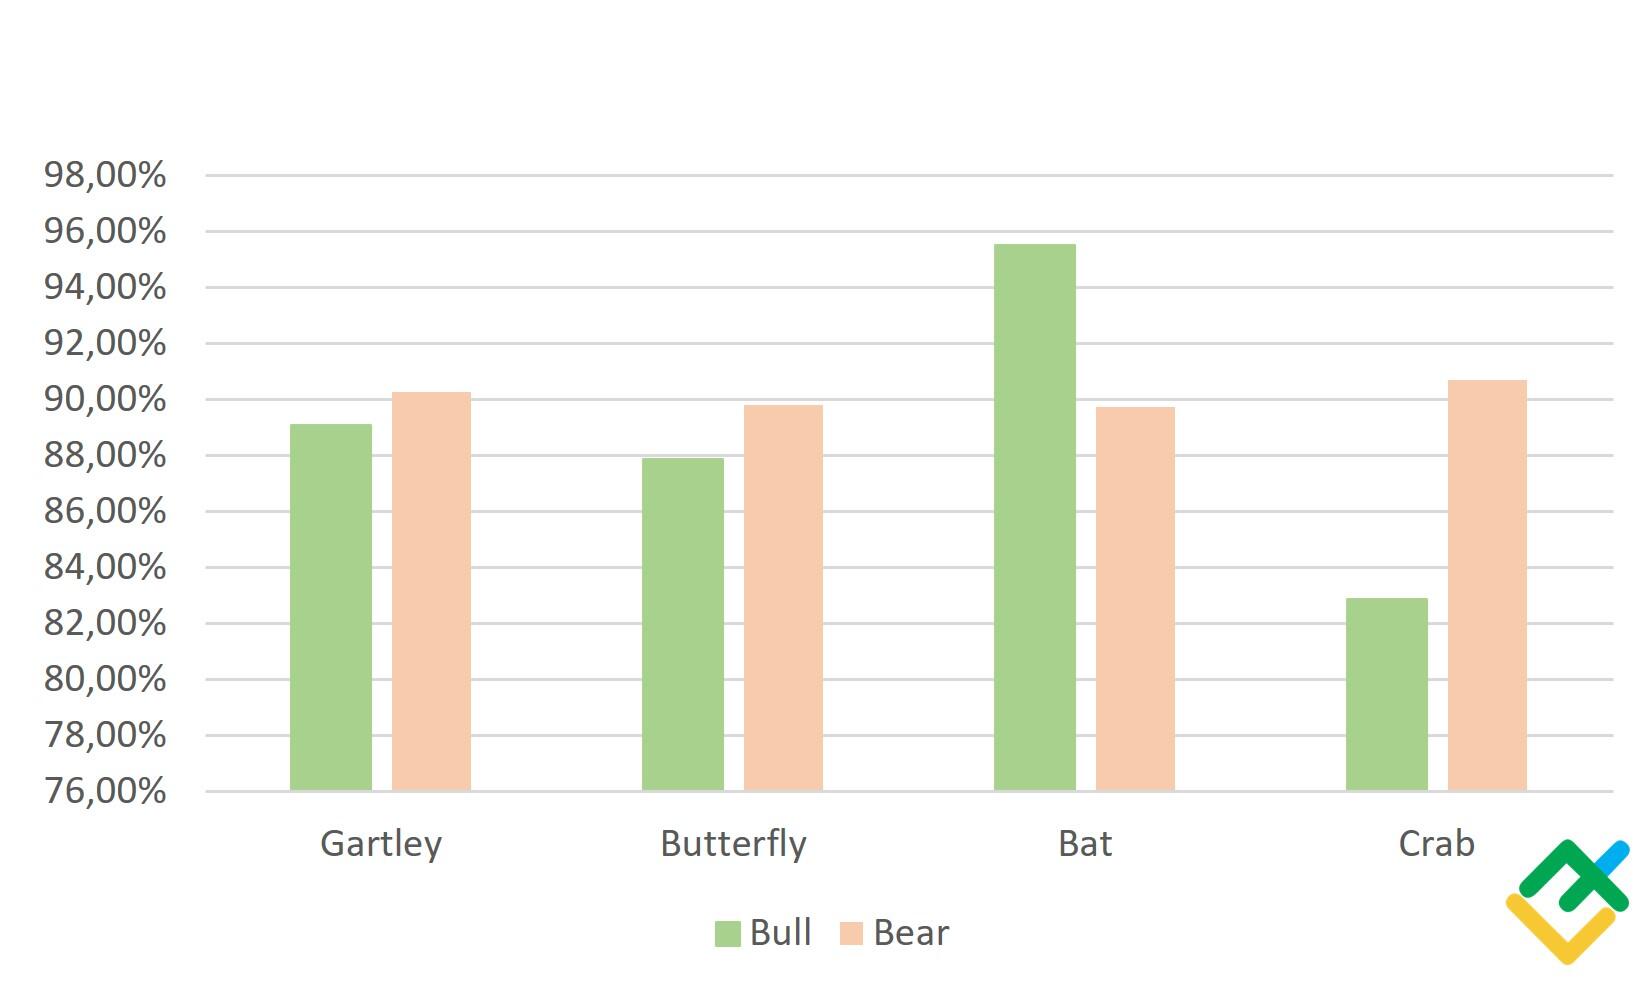
Harmonic pattern success rate
Systematic tests of more than 3000 patterns have shown that the harmonic trading patterns of Gartley, Bat, and Crab work out correctly in more than 85% of cases. This statement is true for both bullish and bearish pattern types. The only exception is the Bull Crab, its accuracy is reduced to 82-83%, which is not critically different from other patterns.
At the same time, your personal trading success may differ from the average indicators. The result depends not only on the patterns’ accuracy but also on the trader’s ability to manage risks.
According to my personal experience, I make profits in 65% -75% of cases. If you manage to get close to my results, then your trading will surely be profitable. It is important to understand that the overall profitability of trading, in addition to the quality of analysis and forecasts, is affected by money management, the ability to correctly determine the take profit and stop loss levels, as well as the trade entry and exit points.
Let’s see how this works in practice.
Bat harmonic pattern
A bat pattern could be divided into two similar parts, the wings. Another feature is that the price can’t break through the high in a bullish pattern or the low in a bearish one.
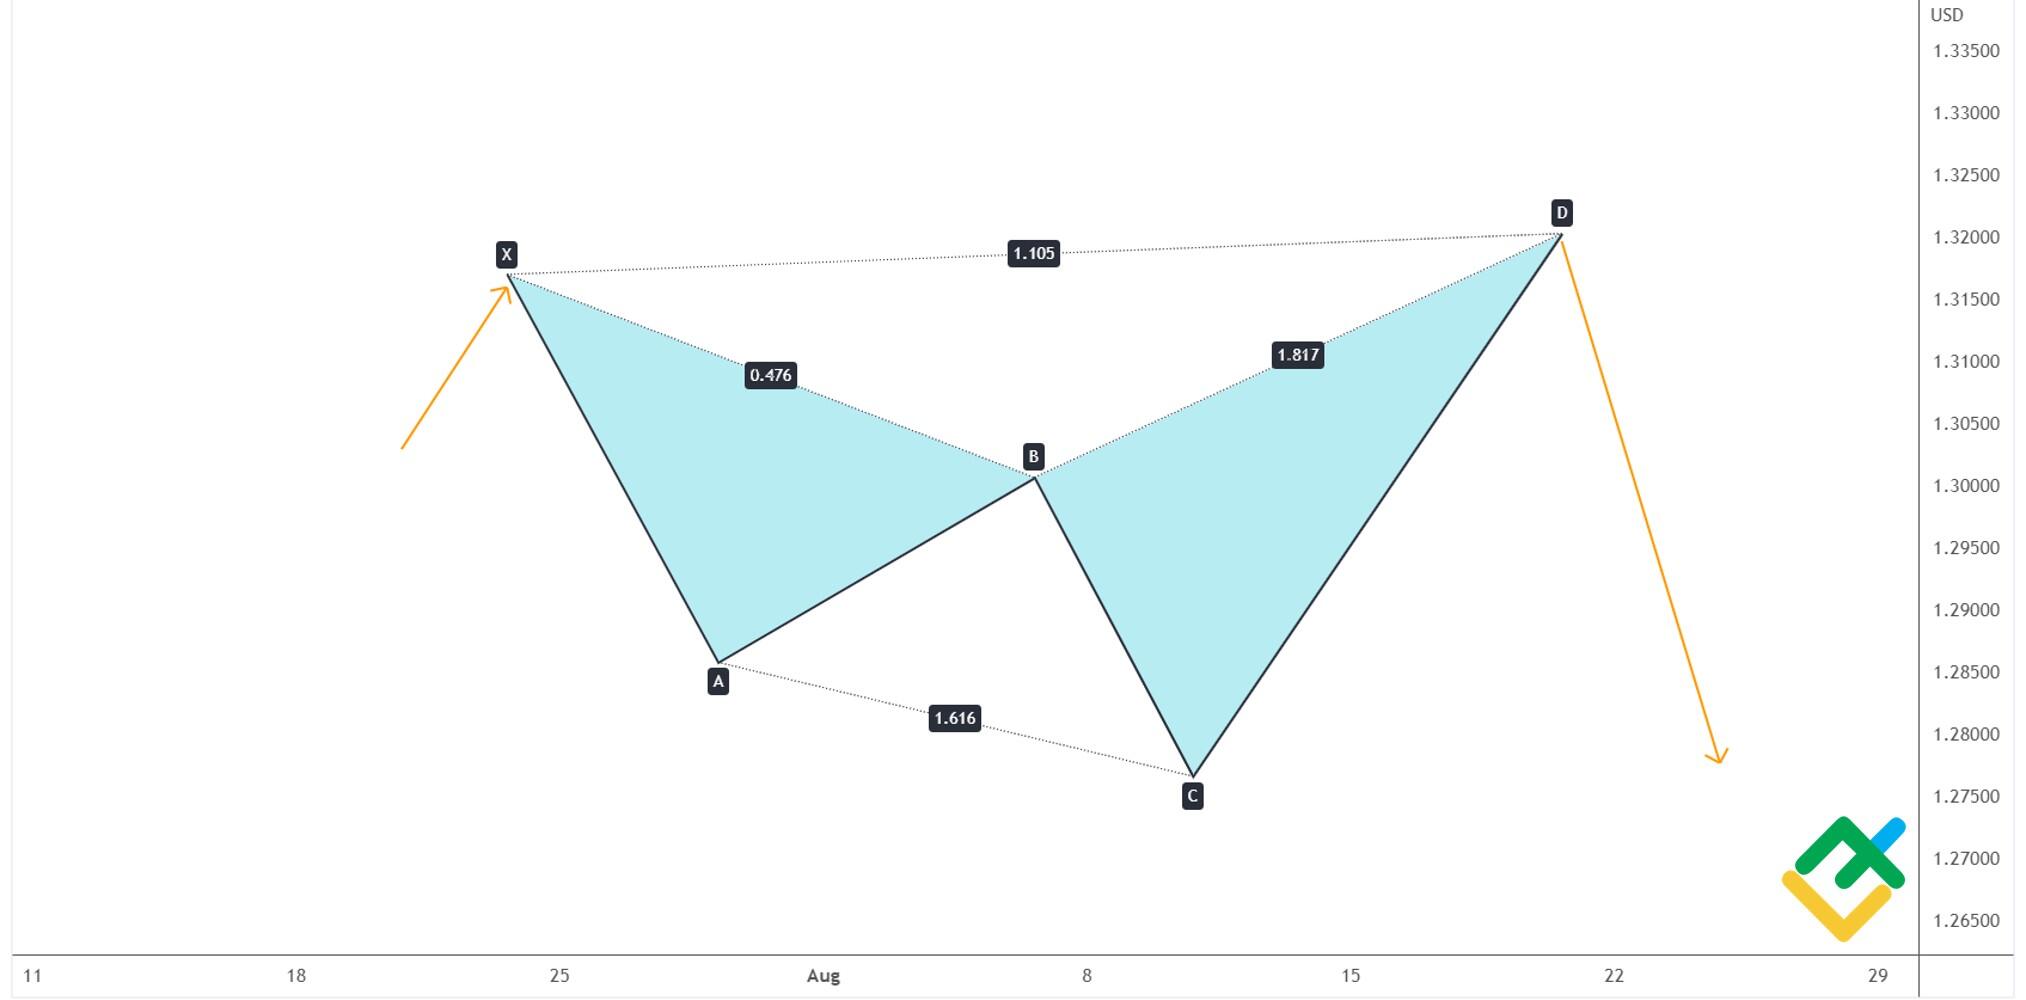
Bearish Bat
Conditions of the Bearish Bat:
- Wave XA is down.
- AB goes up and measures 32.2%–50% of XA.
- BC goes down to the level of 38.2%–88.6% of AB.
- CD is the final wave in the pattern; it rises at a distance of 161.8%–261.8% of AB but within the projection of wave XA.
It is recommended to enter a sell trade around the pivot point D. Stop Loss is set a little higher than point X. To define the target profits, I extend the Fibonacci grid from point A to point D. The first target is set at 61.8%, and the second profit target is at the level of the A point.
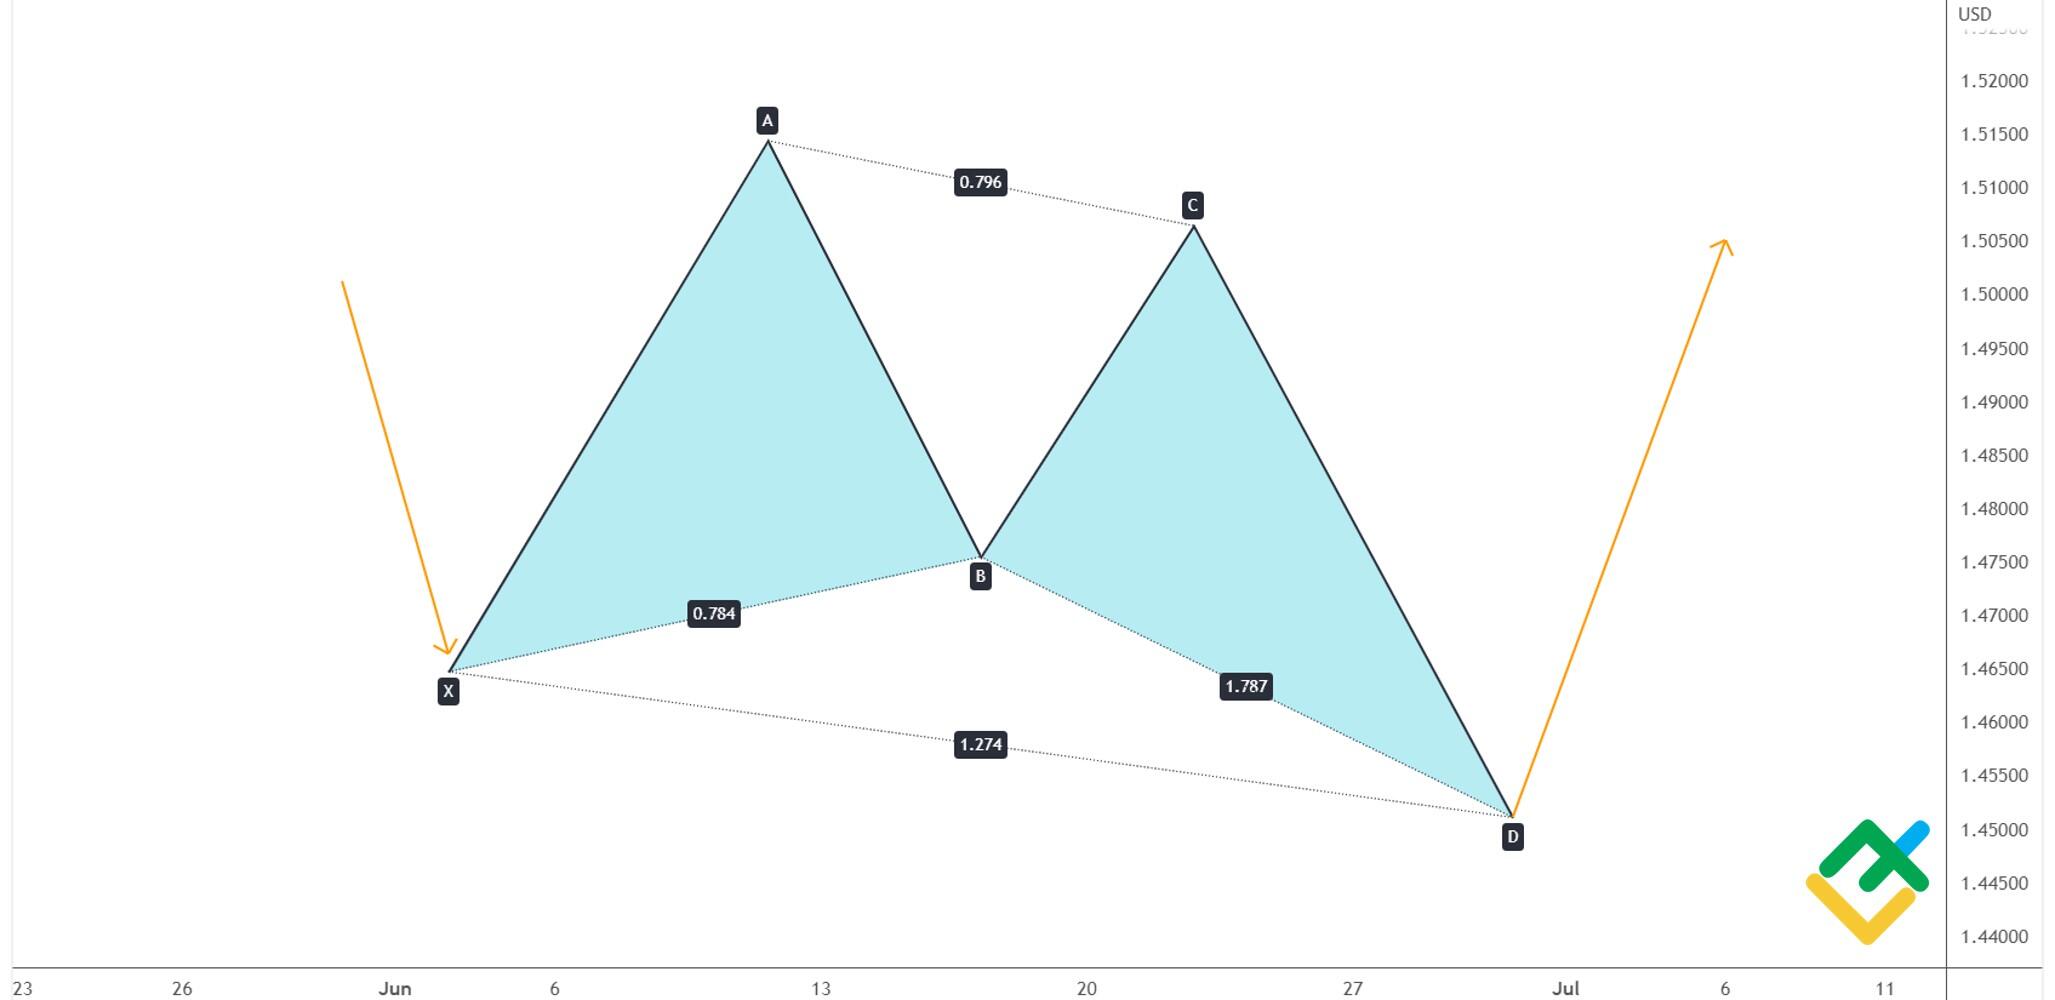
Bullish bat
Conditions for a Bullish Bat:
- XA goes up.
- AB goes down to the level of 32.2%-50% of XA.
- BC goes up to a distance of 38.2%–88.6% of AB.
- CD goes down with an extension of 161.8%–261.8% of AB but within the range of XA.
The market corrects up at the D point. One should enter a long trade here. A stop loss is set a little lower than the X point. Both targets for the movements are defined in the same way. 61.8% and 100% on the Fibonacci grid extended from A to D.
Shark Harmonic Pattern
This pattern looks like an expanding triangle chart pattern. To make it easier to remember this formation, you can imagine the profile of a shark with an open mouth that is chasing prey. In this pattern, the last wave, in its length, absorbs all previous waves.
Like a triangle, the Shark speaks of a likely trend continuation. But this is not always the case. If the efforts of bulls or bears are not enough to continue the trend, then the other side takes the initiative. However, if, instead of a temporary correction, the trend finally reverses, a 5-0 pattern is formed. At first, it may resemble a Shark and is finally determined only after the formation of a trend reversal. You can read more about the 5-0 pattern in this article.
Bearish shark harmonic pattern
Bearish shark features:
- BC goes down and is 112.8%-168.1% of AB. Differently put, the C point is always lower than the A point.
- CD goes up and reaches 88.6%-112.8% of XA.
As a rule, the last wave is the longest, so the Fibonacci extension is built on it. The targets for the Shark are chosen by analogy with the Bat: the nearest one is 61.8%, and the far one is at the level of point C. The stop loss in the case of the bearish Shark is set just above point D.
Bullish shark harmonic pattern
A bullish shark features the swing highs of A and C. The rest of the construction is similar to that of the bearish shark.
Conditions for a bullish shark:
- BC goes up and is 112.8%-168.1% of AB.
- CD goes down and is 88.6%-112.8% of the XA swing.
The Fibonacci extension is based on the CD swing. The nearest target is 61.8%, and the far one is 100%. A stop loss is a little lower than point D.
The above chart displays an example of a bullish shark with a contracted CD leg. This doesn’t break the pattern, but the targets for a buy trade are less clear. You see that the reversal impulse is broken eventually. There isn’t continuous growth.
Crab harmonic pattern
Crab is considered one of the most accurate patterns. The pattern is composed of four waves; it means a soon end of the ongoing trend. The crab pattern is easily discovered because of the extended CD wave, which looks like a crab claw.
Bearish crab harmonic pattern
Conditions:
- AB goes up and is 38.2%–61.8% of XA.
- BC goes down and extends from 38.2% to 88.6% of AB.
- CD is 224%–361.8% of AB. CD often reaches the ratio of 161.8% of XA.
An ideal entry point is the D point; when it forms, one could enter a short trade. The targets are based on the pattern lows. The nearest target is at the B level, the far target is around the A point.
Bullish crab harmonic pattern
Conditions:
- AB goes down and is 38.2%–61.8% of XA.
- BC goes up and is from 38.2% to 88.6% of AB.
- CD is 224%–361,8% of AB or 161.8% of XA.
When the D point is formed, one can enter a long trade. The nearest target is the B point, and the far target is at the level of the A point.
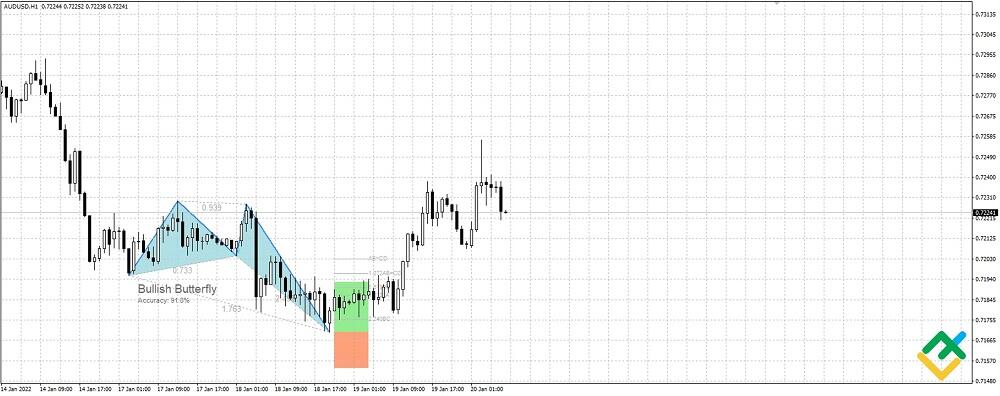
Butterfly harmonic pattern
A butterfly is a reversal pattern that looks like a crab, but CD is not elongated, which makes the XAB and BCD triangles visually almost symmetrical. So, the Bat pattern suggests itself for comparison here; however, in the Butterfly, the CD wave is always longer than the XA wave.
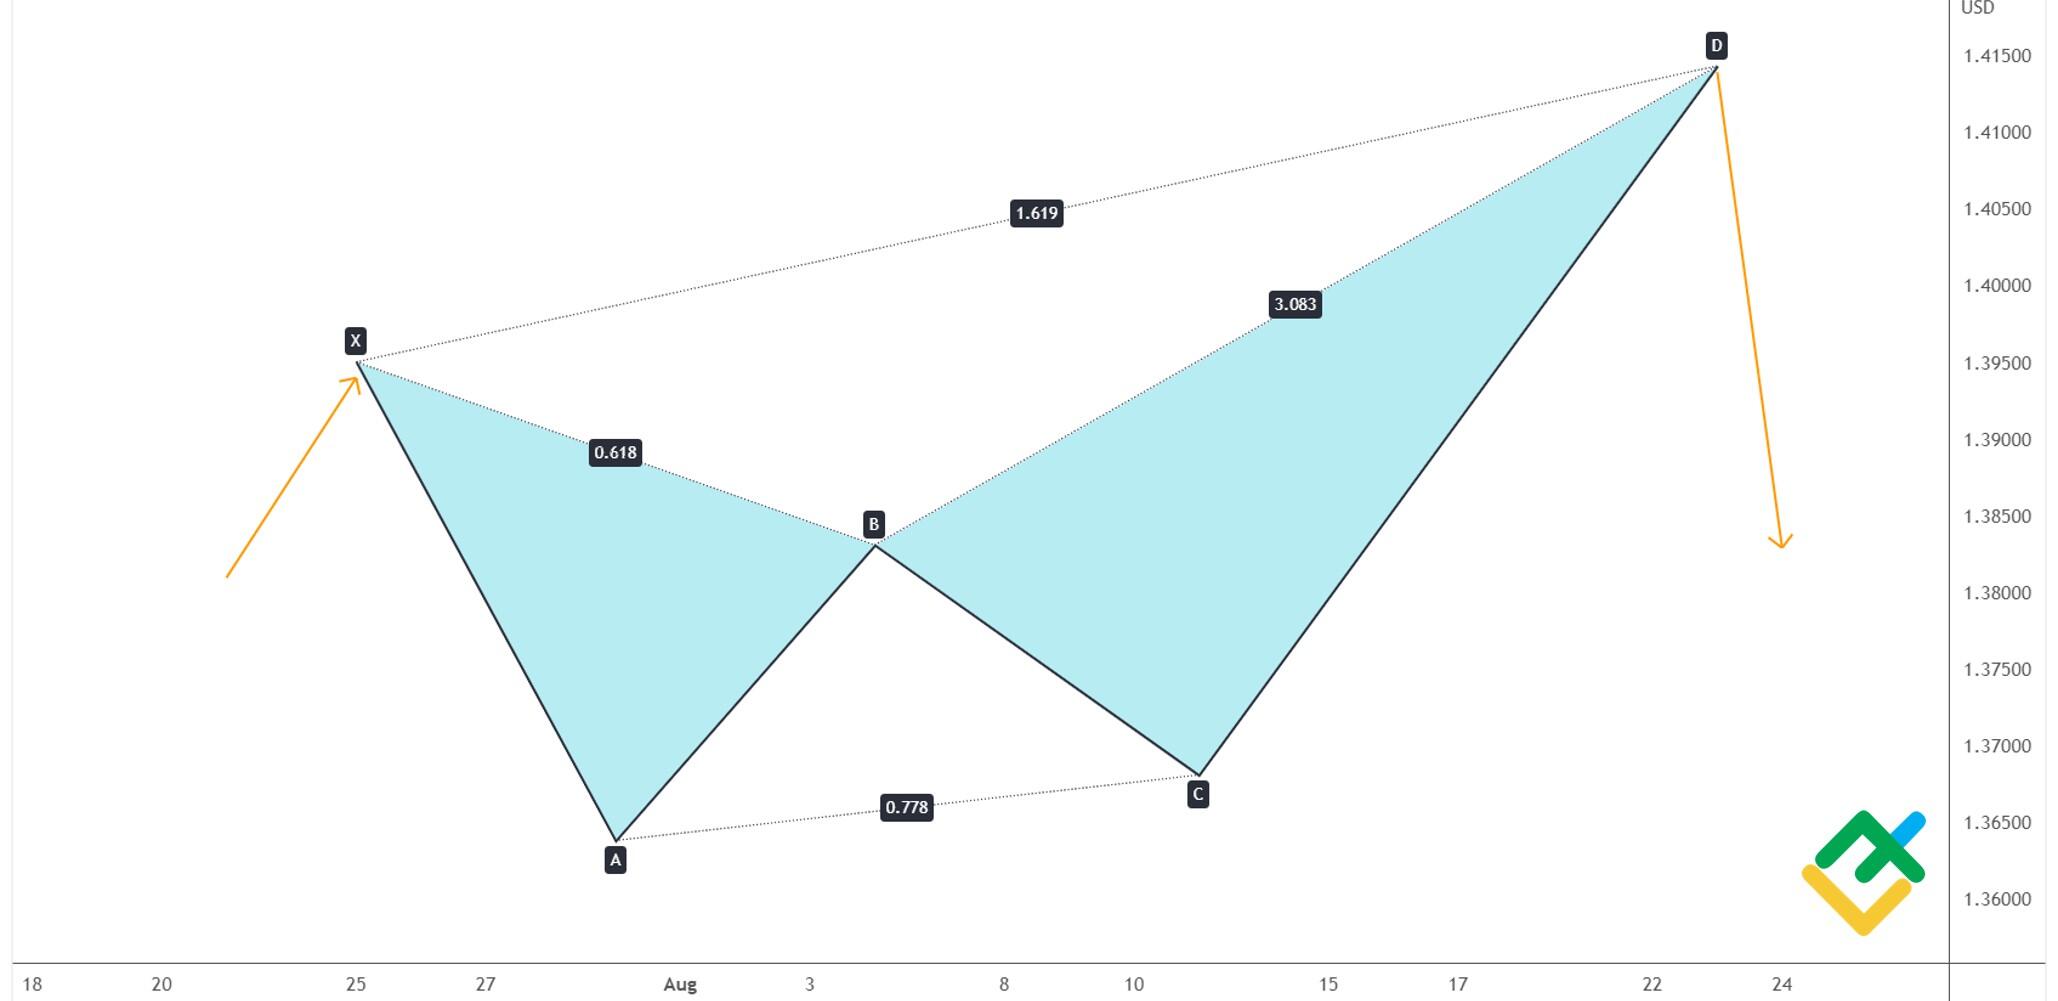
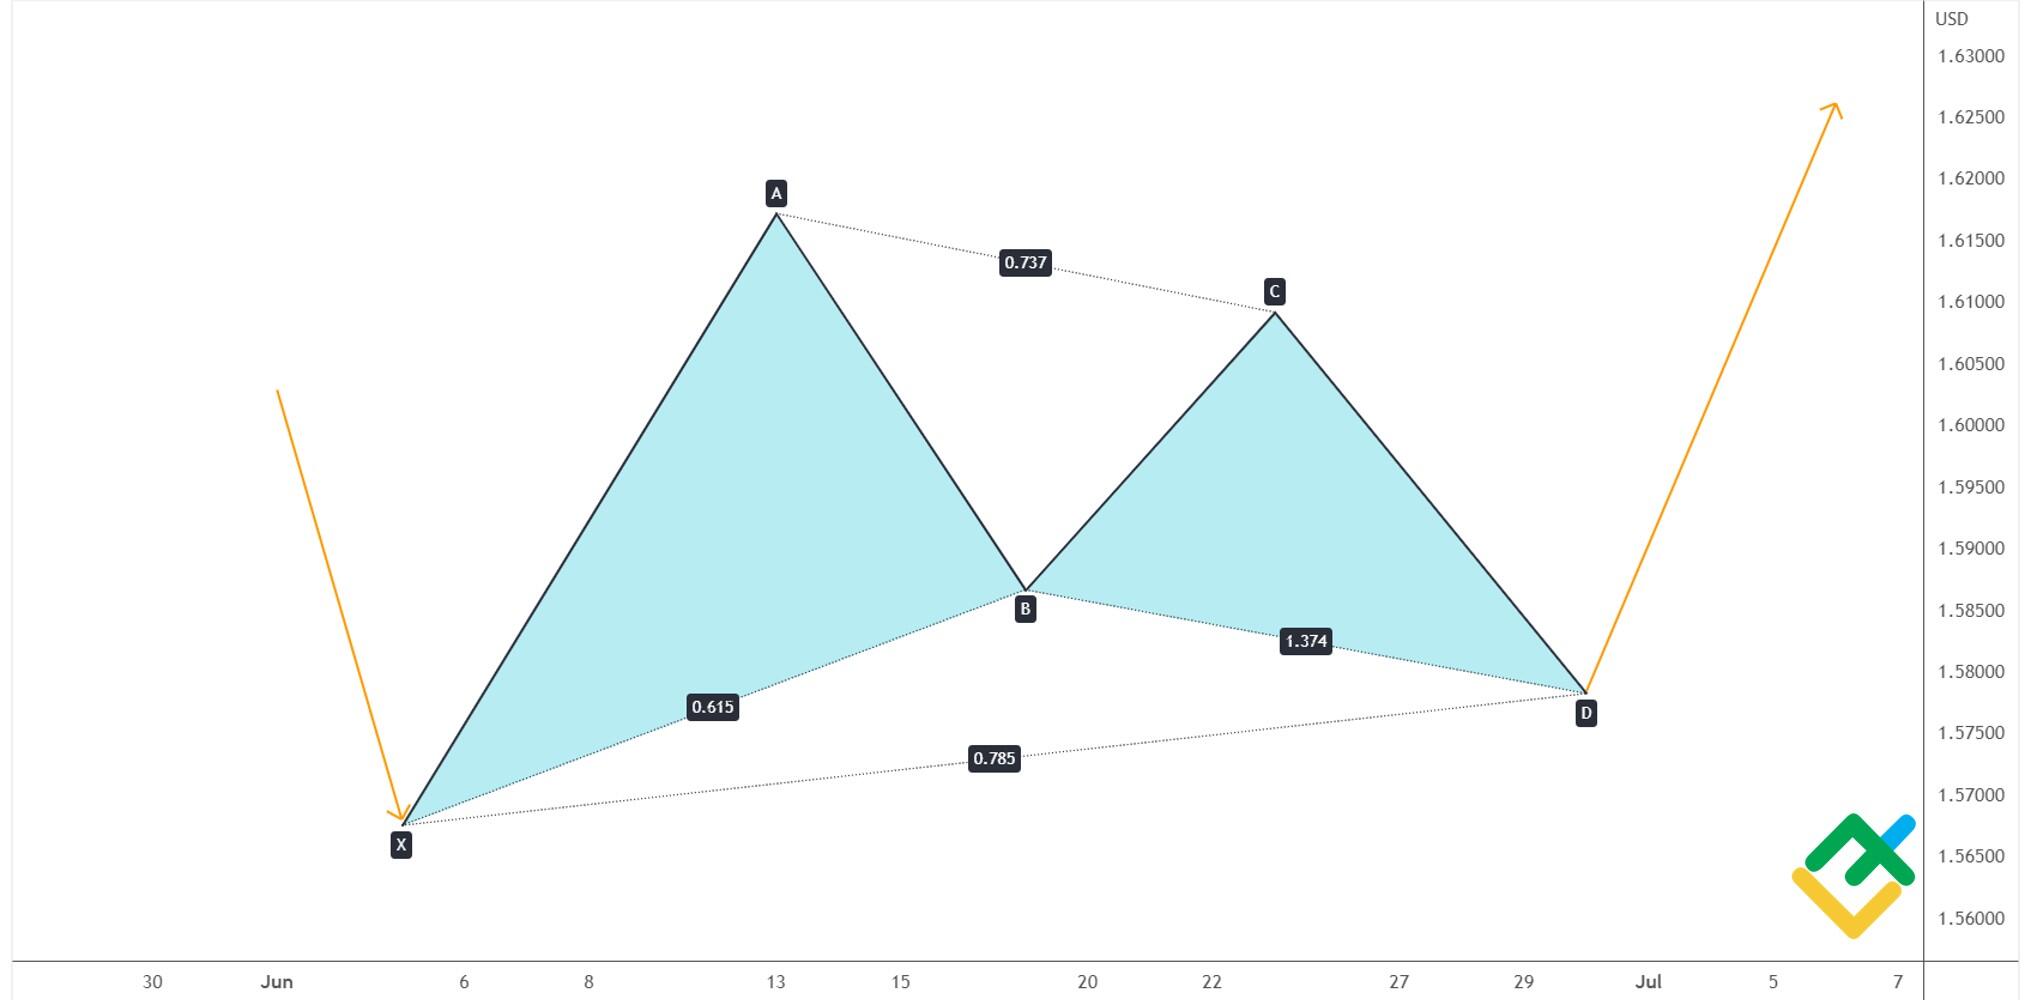
Bullish butterfly harmonic pattern
Conditions:
- XA goes up.
- AB then retraces the XA by 78.6%
- BC goes up and reaches 32.2%–88.6% of the AB.
- CD goes down and reaches 161.8%–224% of AB, 161.8%–261.8% of BC and up to 127.2% of XA.
Enter a trade around the D point. The near target is the level of the B point, and the far one is at A.
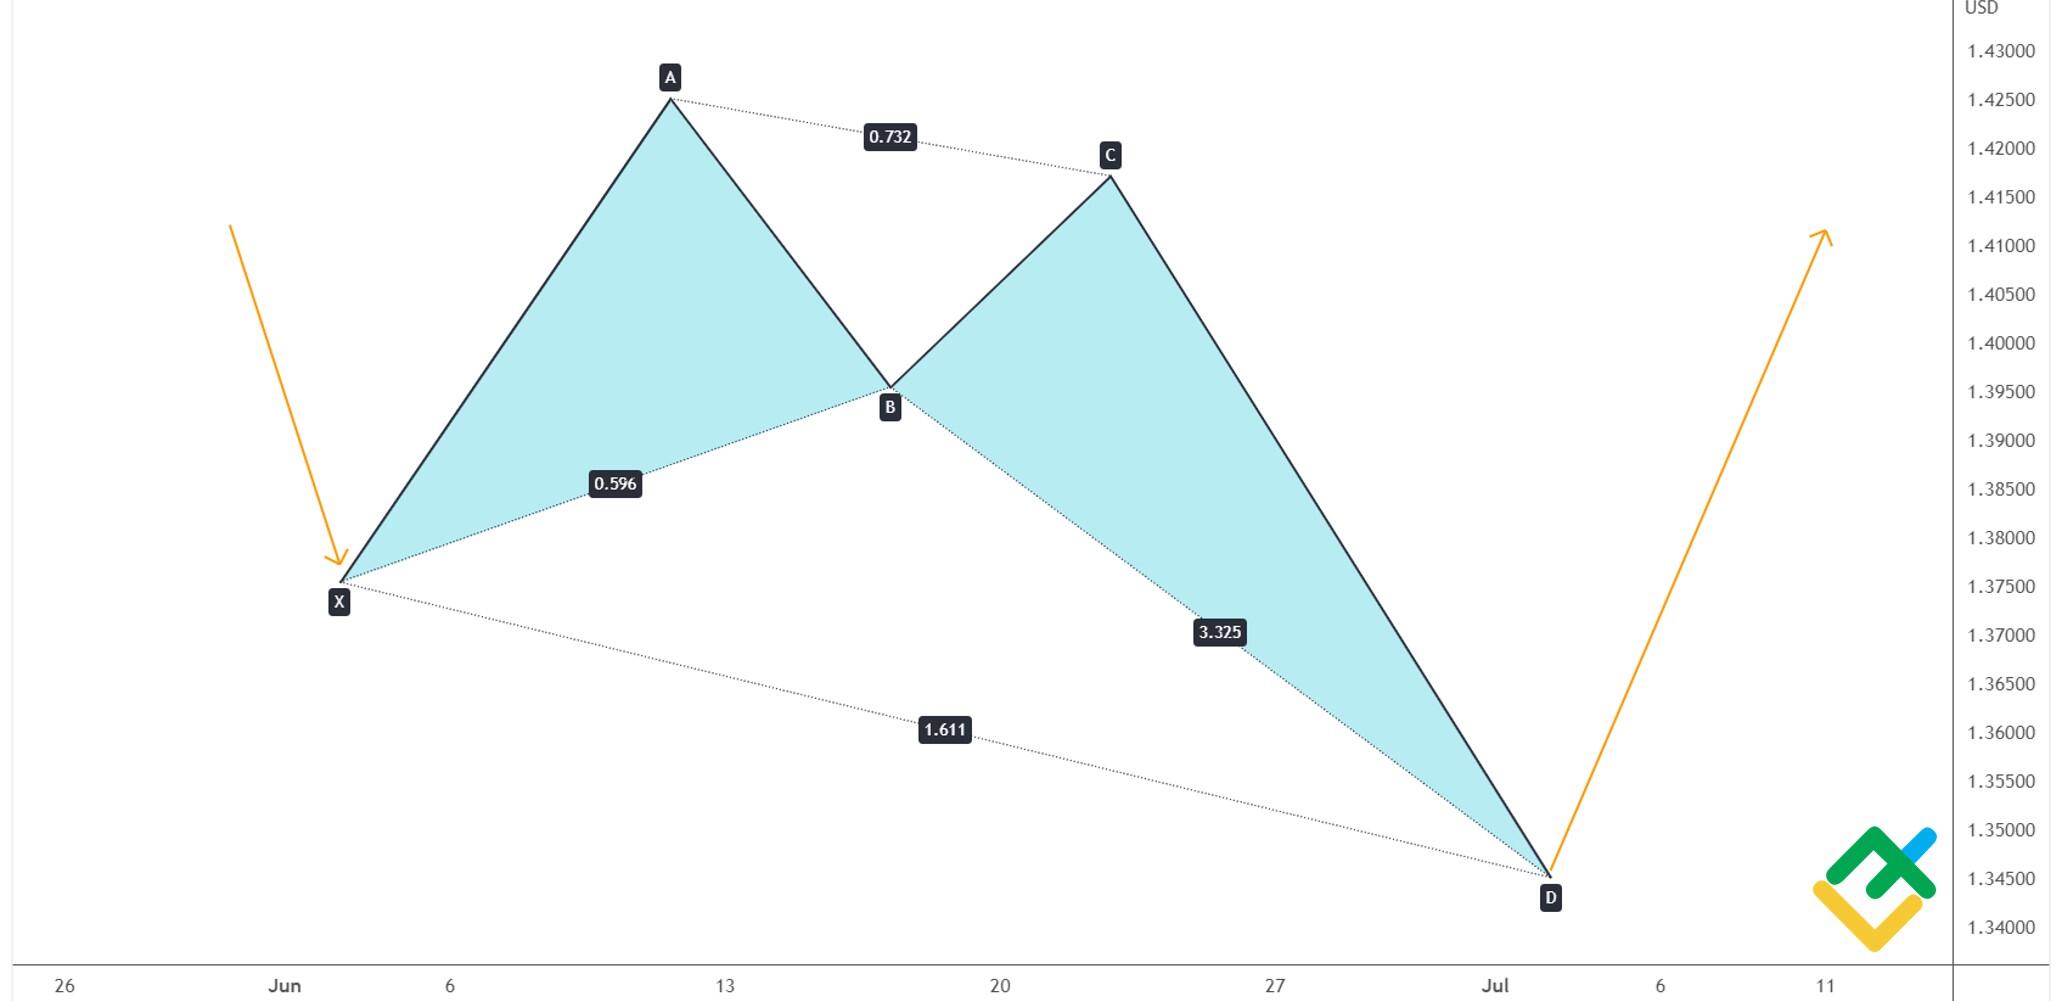
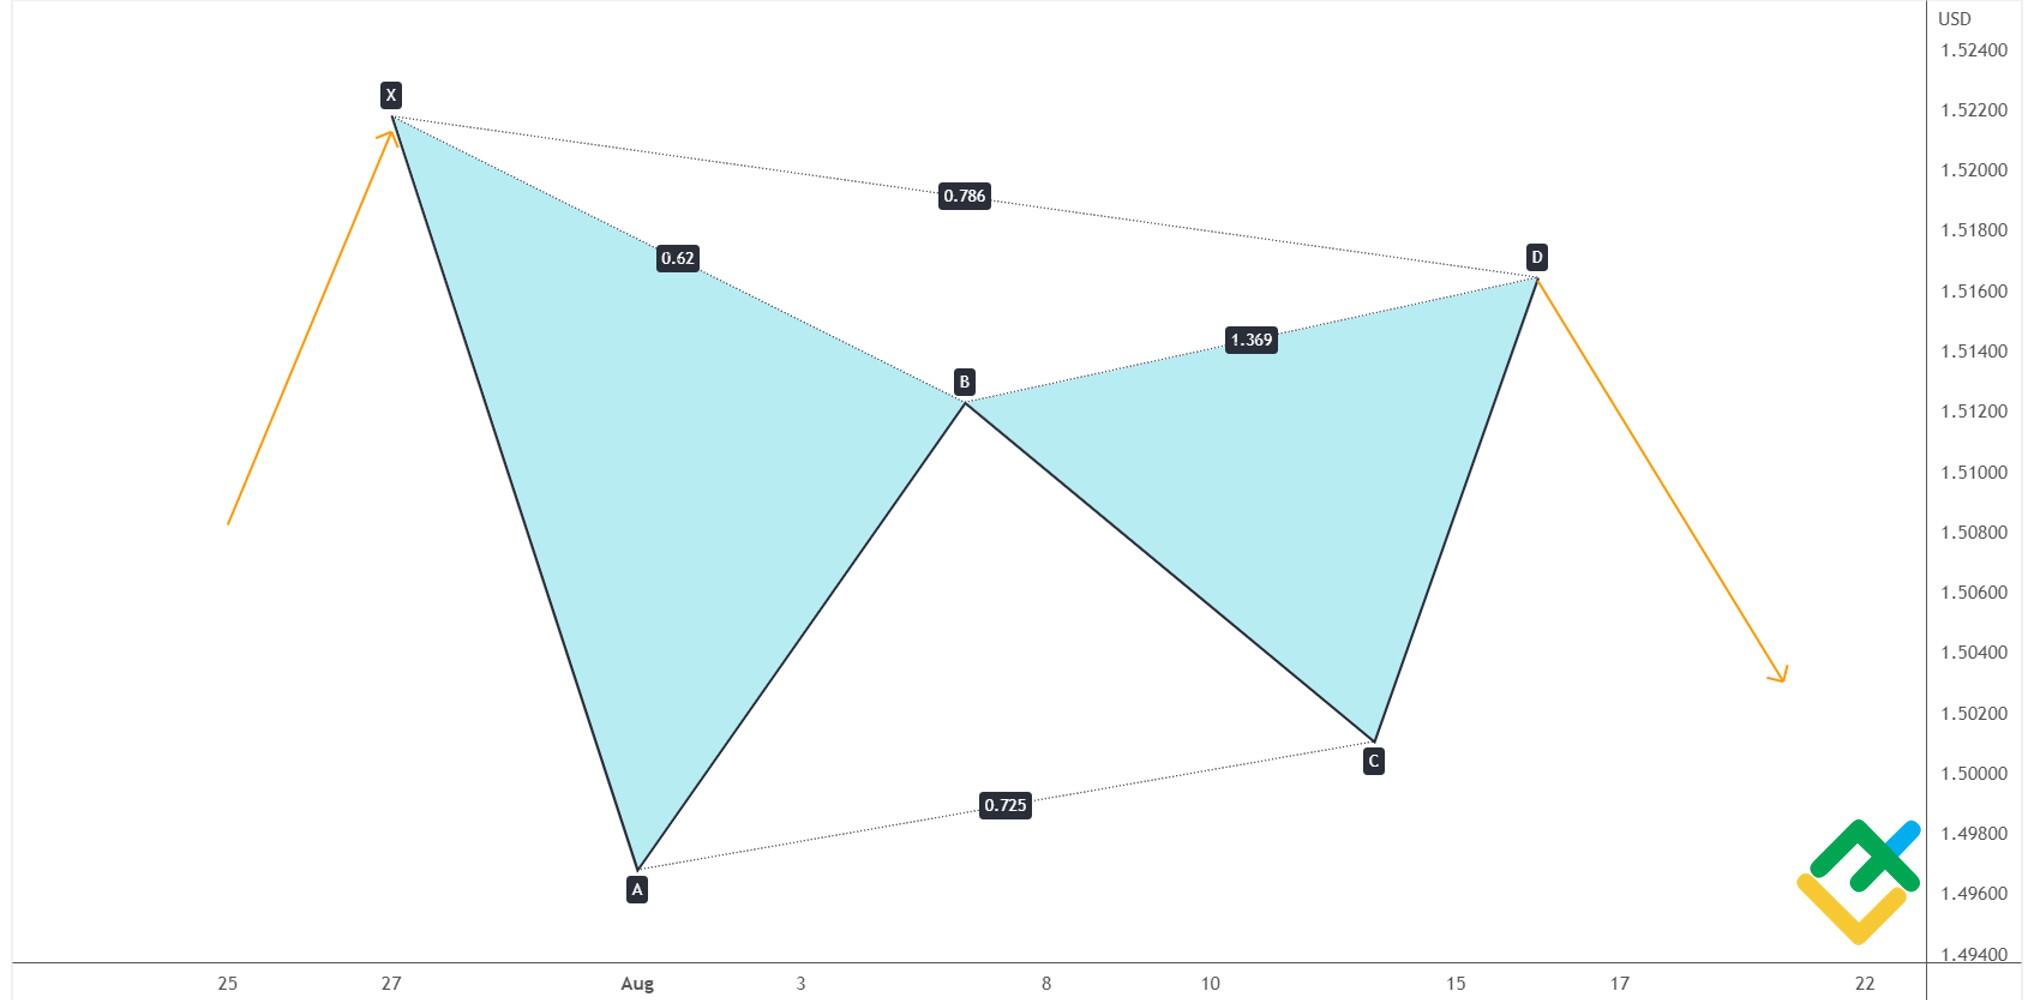
Bearish butterfly harmonic patter
Conditions:
- XA goes down.
- AB goes up and should retrace XA by 78.6%.
- BC goes down and reaches 32.2%–88.6% of AB.
- CD goes up and reaches 161.8%–224% of AB, 161.8%–261.8% of BC, and is up to 127.2% of XA.
When point D forms, you can enter a trade with targets at points B and A.
Gartley harmonic pattern
Gartley pattern suggests a retracement in a trending market. So, the overall trend usually continues after a Gartley pattern completes. A bullish pattern will be followed by an uptrend, and a bearish pattern – by a downtrend. Since Gartley is a harmonic pattern, every swing has to conform to particular Fibonacci levels. The pattern is composed of five points in the chart, X, A, B, C and D.
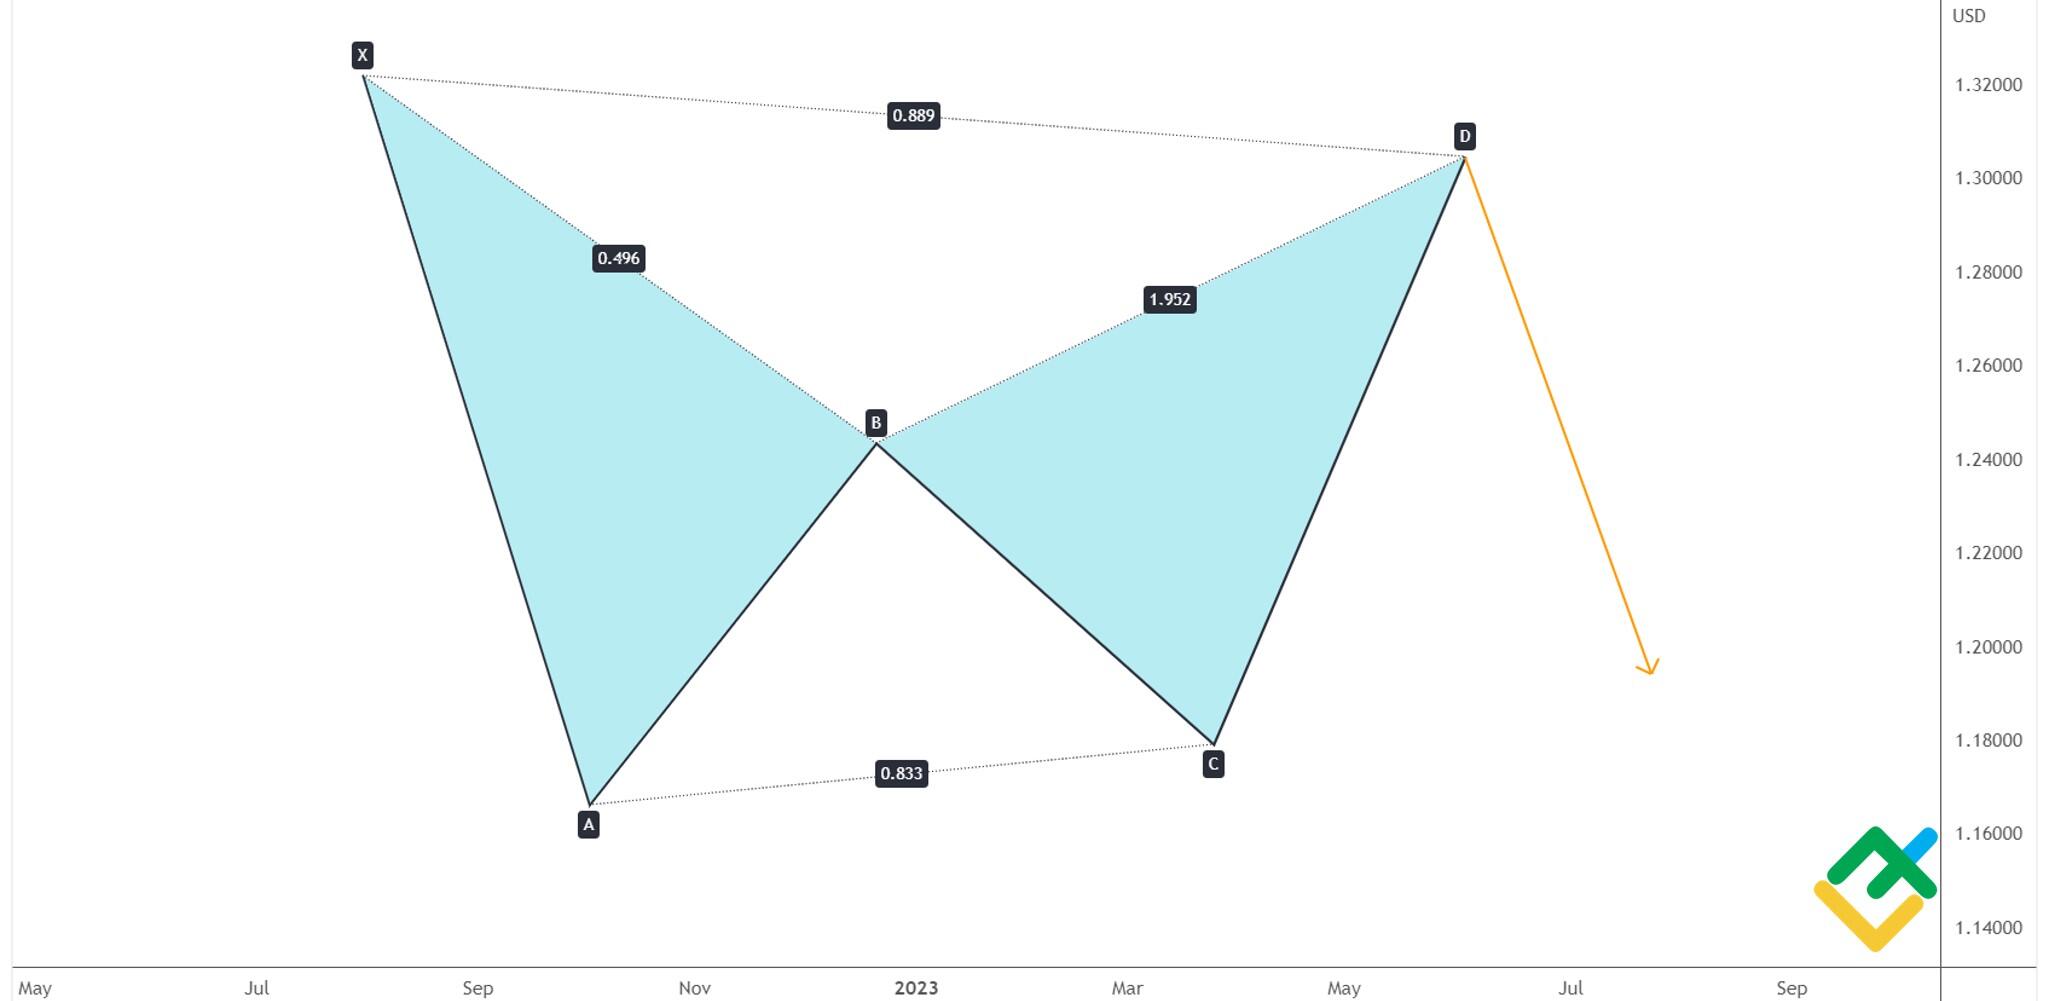
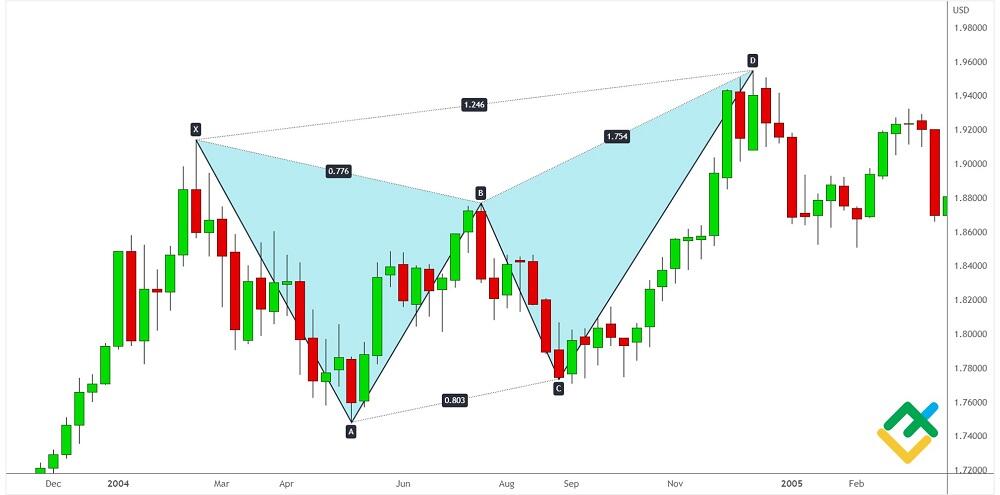
Bearish Gartley
The bearish pattern is similar to the letter W. Gartley can often be seen as an element of a developing triangle. Most often, it occurs at an early stage of trend development, preceding the completion of corrective waves.
A bearish Gartley has the following feature:
- XA goes down.
- AB goes up and retraces XA by 61.8%.
- BC goes down is 38.2% – 88.6% of AB.
- CD goes up and is 127.2%-161.8% of BC.
- AD formation, composed of three sub-waves, goes up and is 78.6% of the XA impulse.
- At the D point (Potential Reversal Zone), there should be the 161.8% Fibonacci extension of the A to D distance projected down.
In a bearish Gartley, there are three short-term targets at levels A, B, and C, as well as a longer-term target of 161.8% of AD.
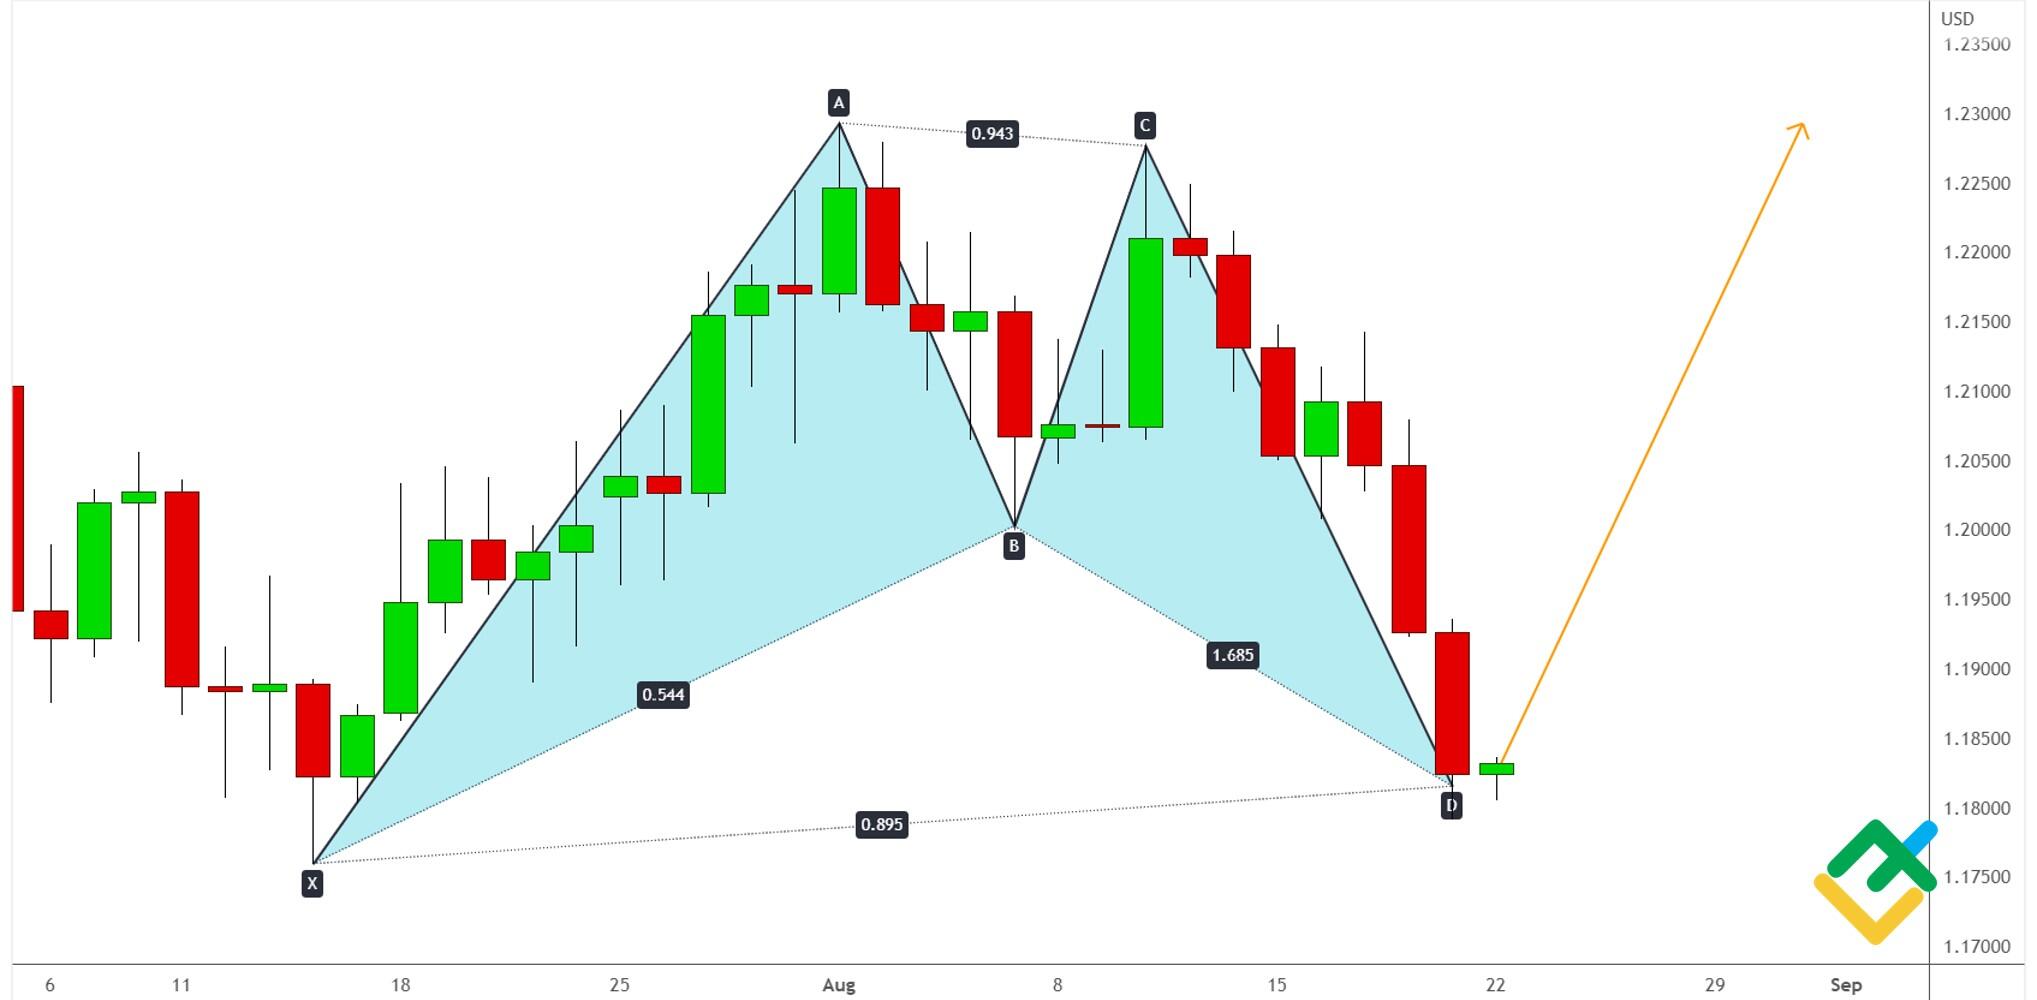
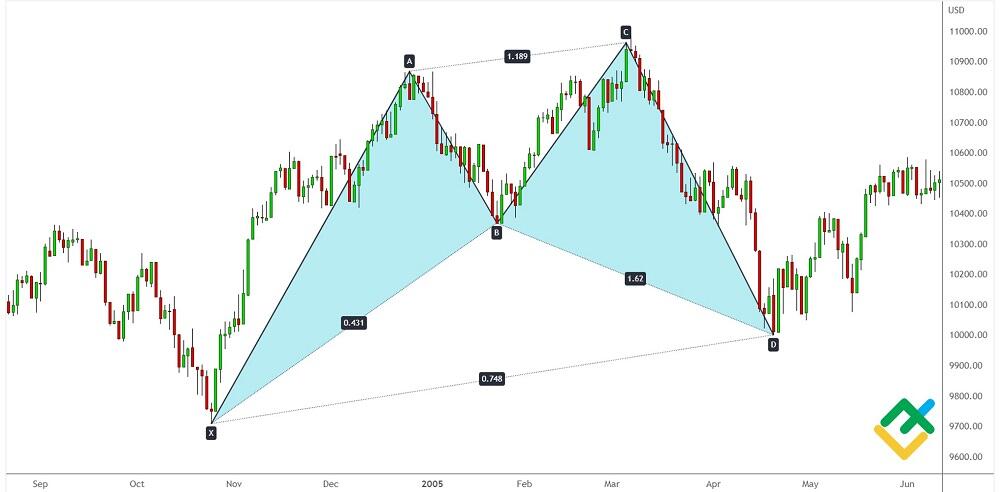
Bullish Gartley harmonic pattern
Bullish Gartley looks like the M letter. After the D point forms, the trend movement continues.
Conditions for bullish Gartley:
- XA goes up.
- AB goes down and is 61.8% of XA.
- BC goes up and is 38.2% – 88.6% of AB.
- CD goes down and is 127.2% – 161.8% of BC.
- The AD formation is directed down and is 78.6% of XA.
- At the D point, the projected movement is up and is 161.8% of AD.
There are three swing targets at points B, C, and D in a bullish Gartley, as well as a reversal target of 161.8% of AD.
Harmonic patterns advantages and disadvantages
| Advantages | Disadvantages |
| All data and conditions for harmonic patterns are clear and exact. The trader deals with precise wave ratios, pivot points, and levels. This greatly simplifies the search for optimal entry points. | The variety of harmonic patterns is rather wide, and their geometry is rather complicated. So, inexperienced traders get confused and make wrong trading decisions. |
| Reliability of the pattern development. In addition to the geometric form, the truth of harmonic patterns is established using the relationships between the waves. Moreover, many complex formations can be compared not with one neighboring, but with several impulses with unique ratios. | The pattern is not always confirmed through the projection of price movements. An illustrative example is the Shark pattern, which, in the event of a reversal, turns into a completely different 5-0 pattern. |
| Harmonic patterns appear in the chart often enough that traders can use them in their trading systems regularly. | There is no sufficiently accurate automatic tool for identifying harmonic patterns. |
| Harmonic patterns work for all types of markets and timeframes. | In the same chart section, but on different timeframes, patterns opposite to each other can be built. |
| Harmonic patterns can be efficiently combined with other technical analysis tools. | A harmonic pattern that meets strict aspect ratio criteria is very rare in real trading charts. Because of this, subjectivity is growing in the assessment and there is a probability of a false forecast. |
Harmonic pattern indicators
Harmonic patterns constantly repeat each other. Basically, there are two types of patterns: five-point reversal patterns and five-point extension patterns. Their similarity with each other opens up wide opportunities for algorithmic market analysis. Let us have a look at the most effective harmonic pattern indicators.
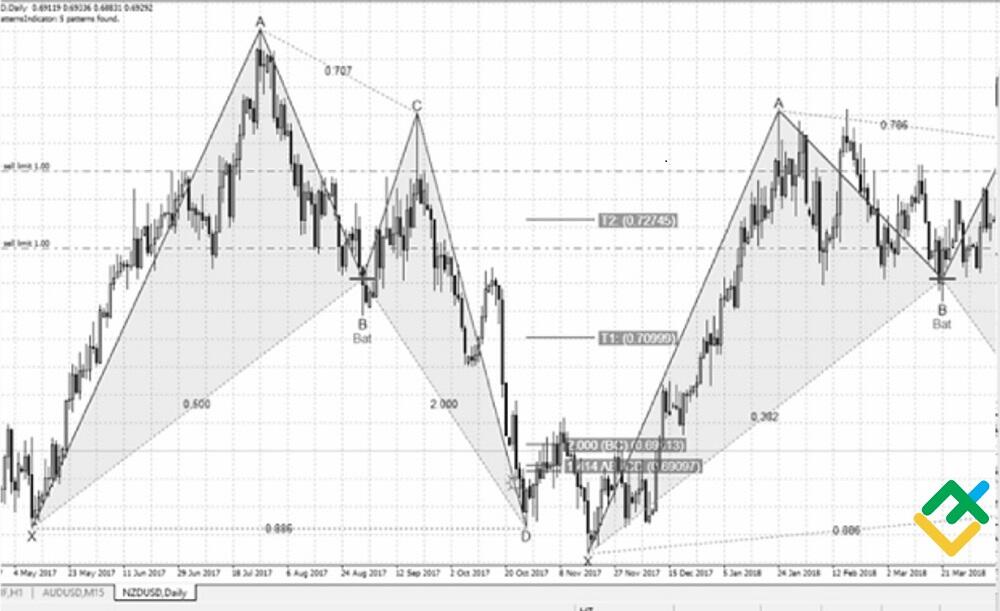
Harmonic pattern scanner mt4
The Harmonic Pattern Finder MT4 scanner has an intuitive interface, and its functionality is enough even for professional traders.
The scanner is able to detect seven types of patterns in different markets and timeframes:
- Bat;
- Gartley;
- Butterfly;
- Crab;
- Deep Crab;
- Shark;
- ALT Bat.
The indicator software is installed in a common way: you should paste the downloaded file in the Indicator folder.
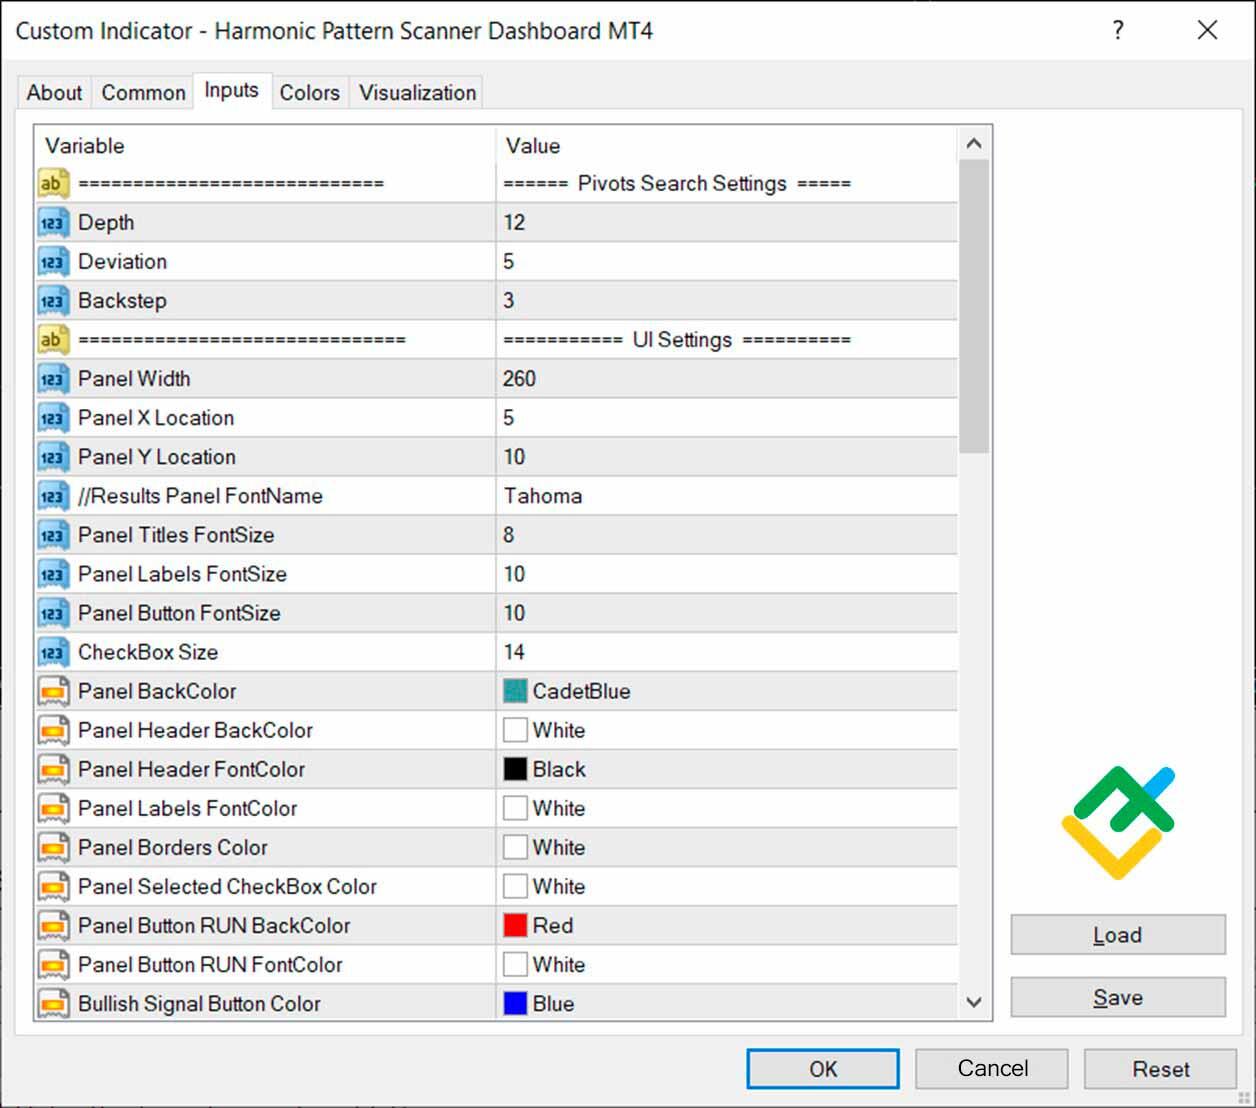
Despite the numerous parameters, the indicator is quite straightforward and user-friendly. You can specify the types of currency pairs that the algorithm will analyze, timeframes, and displayed types of patterns. You can also change the visual display of patterns.
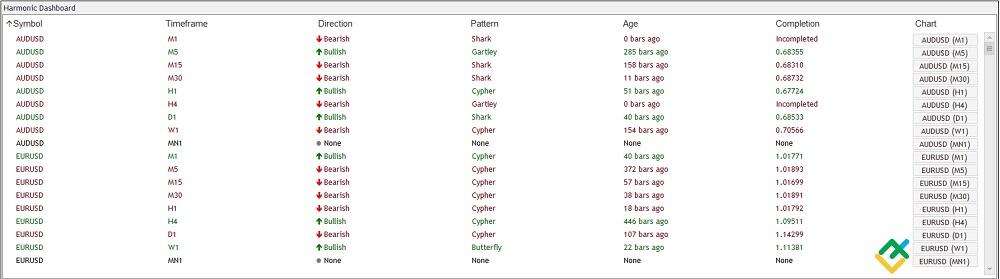
When you run the indicator, it immediately starts scanning selected instruments. The developers claim that HPF is capable of simultaneously scanning up to 1600 charts. The discovered patterns are displayed as a list. Optionally, one can set up notifications that will be sent when a new pattern is found, and the trader can open necessary charts right away.

The identified patterns are displayed very clearly in the chart. The tool also indicates the type of pattern, its direction (bullish or bearish), key points, as well as Fibonacci ratios.
Shepherd harmonic pattern indicator
It is another tool defining harmonic patterns forex, which builds formations using manual and algorithmic methods.
How the Shepherd Harmonic Pattern works:
- It spots harmonic patterns and price action patterns (InsideBar, Pinbar, OutSideBar);
- It draws Fibonacci levels and pivot points to visually display the pattern’s ratios;
- You can set alerts for price and time levels (targets, stop levels, entry points, etc.);
- The user can move detected patterns from longer timeframes to shorter ones;
- Additionally, it detects divergences, which serve as a good confirmation of the main signals (divergences are displayed in the chart as yellow arrows);
- Calculates the optimal trading volume for each pattern that corresponds to the risk level specified in the settings.
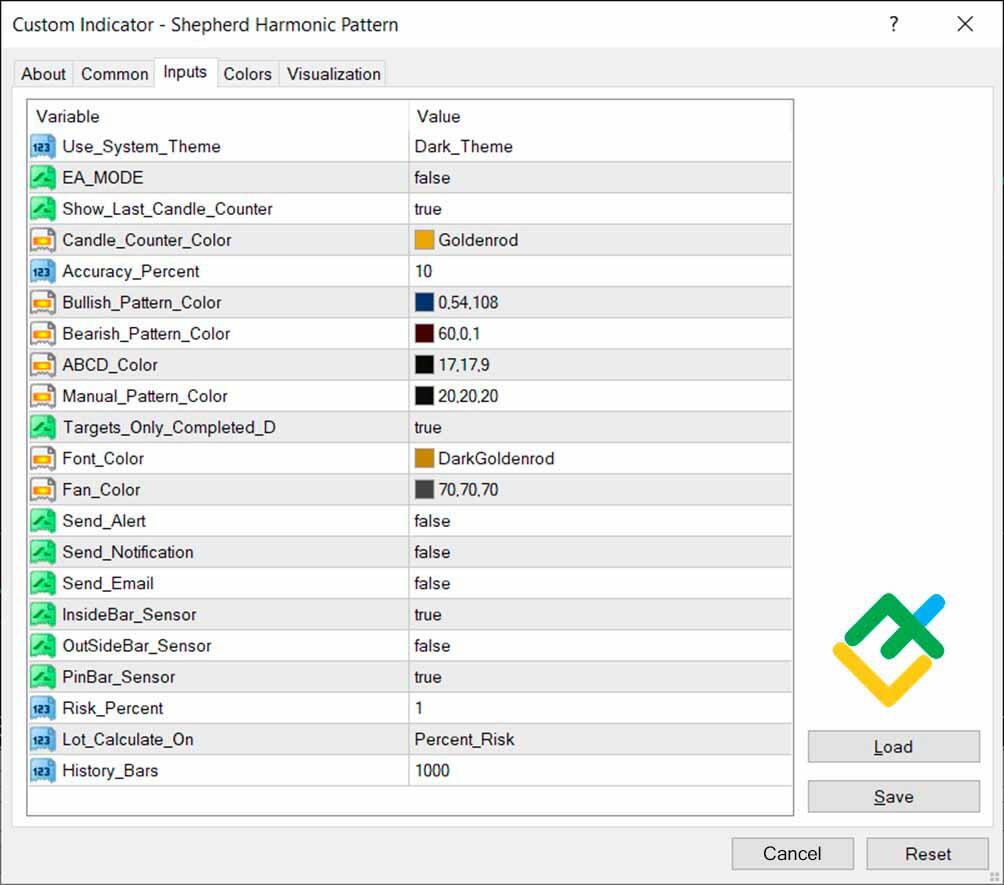
You can adjust almost all parameters in Shepherd Harmonic Pattern:
- Use System Visuals — enables the visual design of the indicator;
- Show Last Candle Counter — enables candlestick counter;
- Candle Counter Color — changes the colour of the candlestick counter;
- Accuracy Percent — sets the percentage of acceptable accuracy of pattern ratios;
- Bullish Pattern Color — changes the colour of bullish patterns;
- Bearish Pattern Color — changes the colour of bearish patterns;
- ABCD Color — sets the colour of the AB=CD patterns;
- Manual Pattern Color — changes the coulour of manual patterns;
- Targets Only Completed D — enables the display of targets only on the completed patterns;
- Font Color — changes the font colour;
- Fan Color — sets the colour of the Fibonacci fan;
- Send Alert — enables alerts;
- Send Notification — enables notifications;
- Send Email —enables e-mail notifications;
- InsideBar Sensor —enables the function of Inside Bar patterns detection;
- OutSideBar Sensor — enables the function of Outside Bar patterns detection;
- PinBar Sensor — enables the function of Pin Bar patterns detection
- Risk Percent —acceptable level of risk in percentage for calculating stops based on patterns and balance;
- History Bars — the maximum number of bars that the indicator uses for calculations.
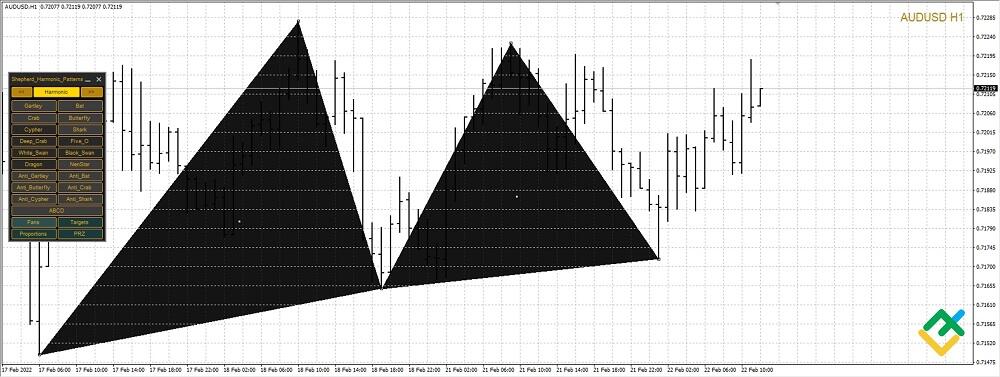
Once launched, the indicator automatically searches for harmonic patterns. On the panel on the left side, you can specify the type of patterns that will be displayed on the chart. There are about two dozen patterns to choose from, including such rare ones as the Dragon, White and Black Swan.
Monster harmonic indicator
One of the features of Monster Harmonics is its ability to recognize unfinished harmonic patterns. This allows the trader to predict the price reversal point in advance and enter a trade at the best price.
The list of recognized patterns is not as large as that of Shepherd (Gartley, Bat, Crab, Butterfly, AB=CD, Monogram, Black Swan, White Swan, Shark), but you can add custom patterns.
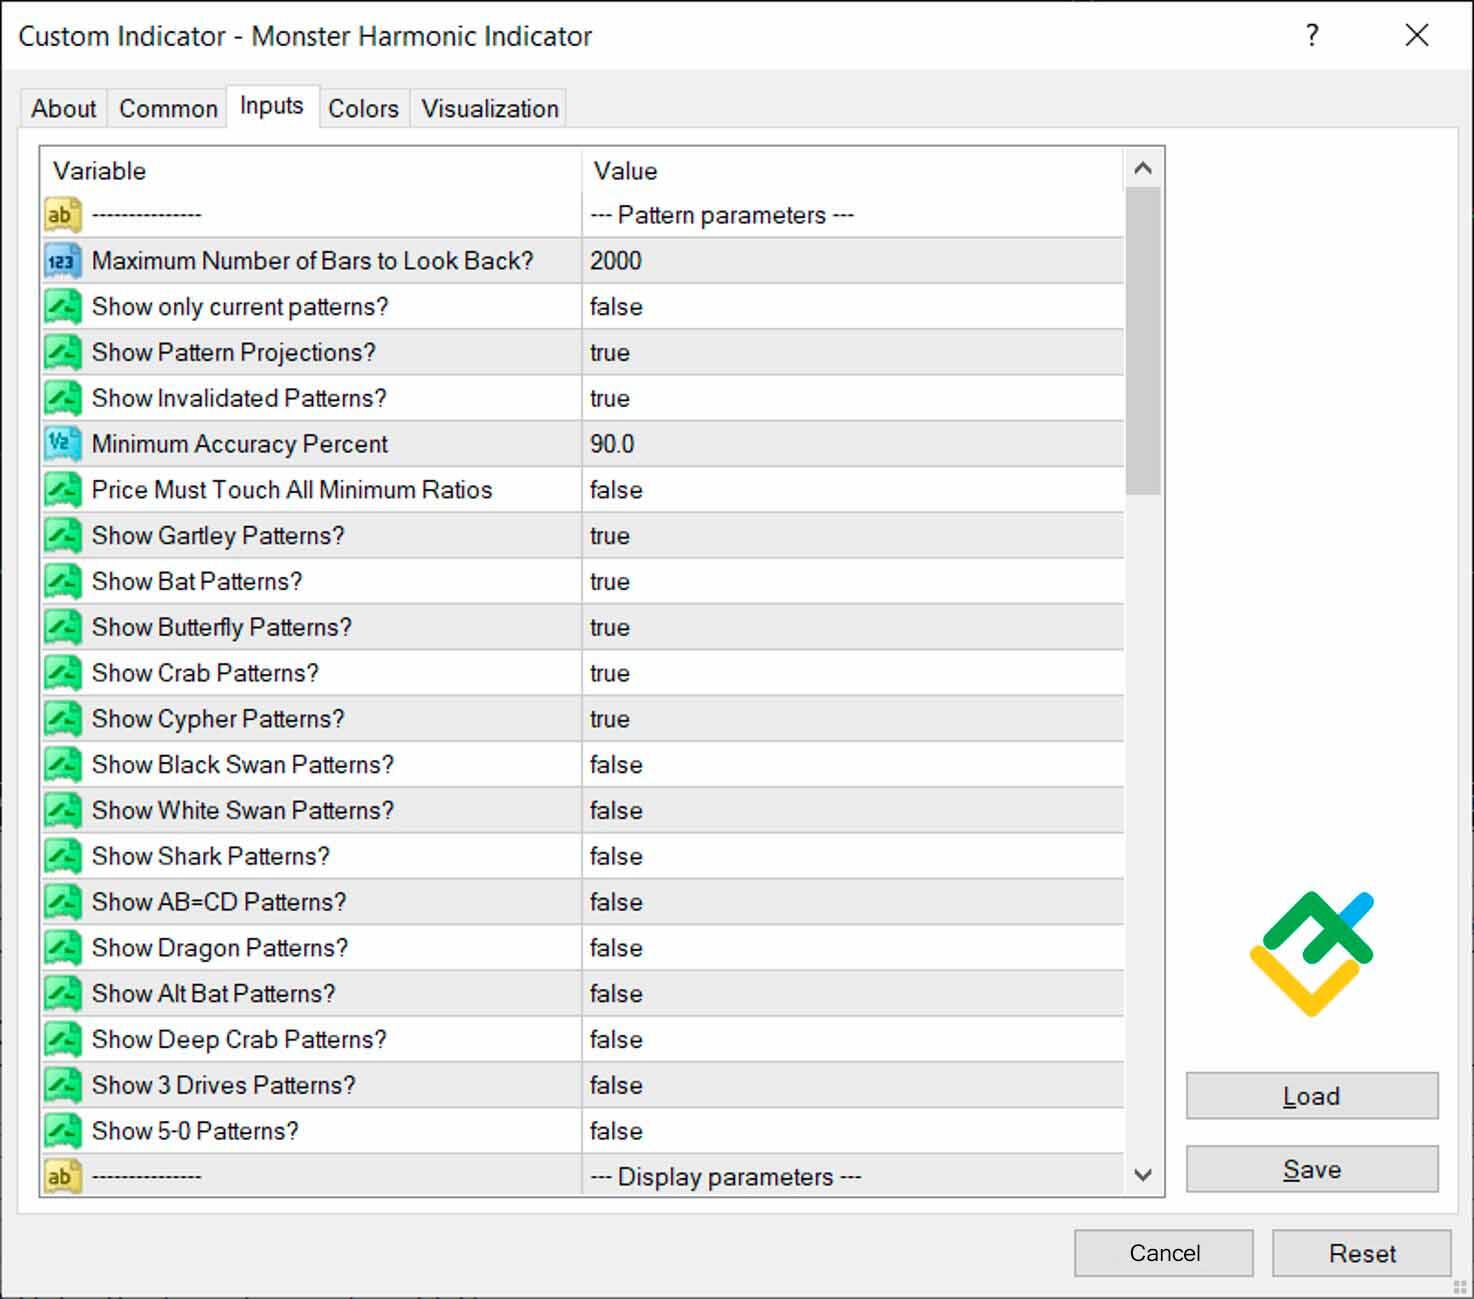
The functionality of MetaTrader does not allow adding tools for creating custom models to the terminal. To add your own patterns, you need to find the Monster_UserPatterns.csv file in the user data folder and edit it.
Harmonic patterns are analyzed in real-time. In the chart, they are displayed as geometric shapes indicating the proportions, type, and risks involved, as well as optimal entry points.
Harmonic patterns EA
In addition to indicators, there are Expert Advisors for MT4 designed to automate trading on harmonic patterns.
Harmonics Trader is an Expert Advisor that, in addition to classic patterns like the Butterfly and Crab, uses little-known harmonic formations, such as New CypherCrab, Navarro 200, and Leonardo. The robot is suitable for desktop and mobile versions of MetaTrader. Thanks to the 14-day trial version, anyone can test it. Paid plans start at $149.
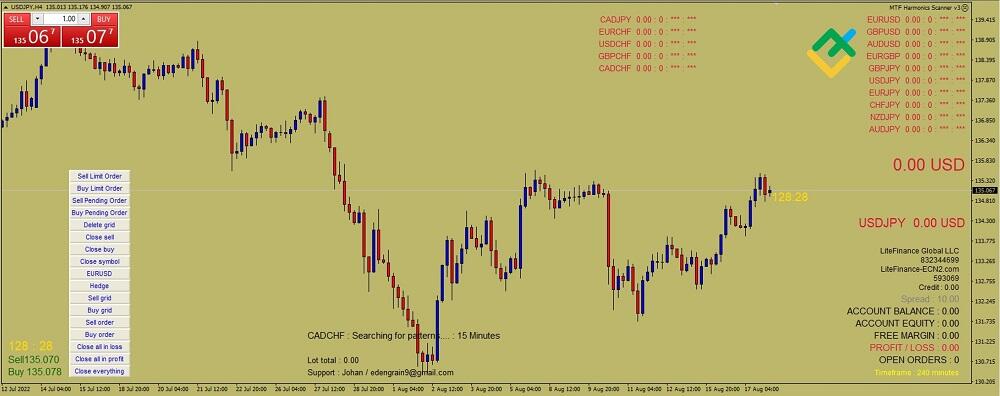
MTF Harmonics Scanner detects and trades Gartley harmonic patterns on 28 currency pairs. One of the advantages of the Expert Advisor is its flexible settings: the user can choose currency pairs for analysis, enable martingale, change the lot size and the degree of acceptable risk.
How to trade harmonic patterns – beginners guide
Now that you’ve become familiar with harmonic patterns and the tools for identifying them, you can go on to trade harmonic patterns.
A general harmonic pattern trading plan is as follows:
Step 1
Locate a potential pattern and its direction. Draw the formation, identify the ratios and relationships between the waves. Based on the proportions, determine the harmonic pattern type.
Step 2
Define the final goal and Initial Profit Objective (IPO) & Profit Protection Zone (PPZ).
The most convenient way is to use the ratio between XA and CD.
Step 3
Enter a trade at the price reversal at the D point.
Step 4
Set a stop-loss in the Stop Loss Zone (SLZ).
Step 5
If there are signs of a price reversal near one of the targets, exit the trade.
Depending on the pattern, the target profits may differ. However, for most formations, the likely targets will be the levels of points C and A, as well as 127% and 161% of the AD length. To reduce the risks, it makes sense to set a trailing stop with a step of about 30% of the AD length.
Example of harmonic trading in Forex market
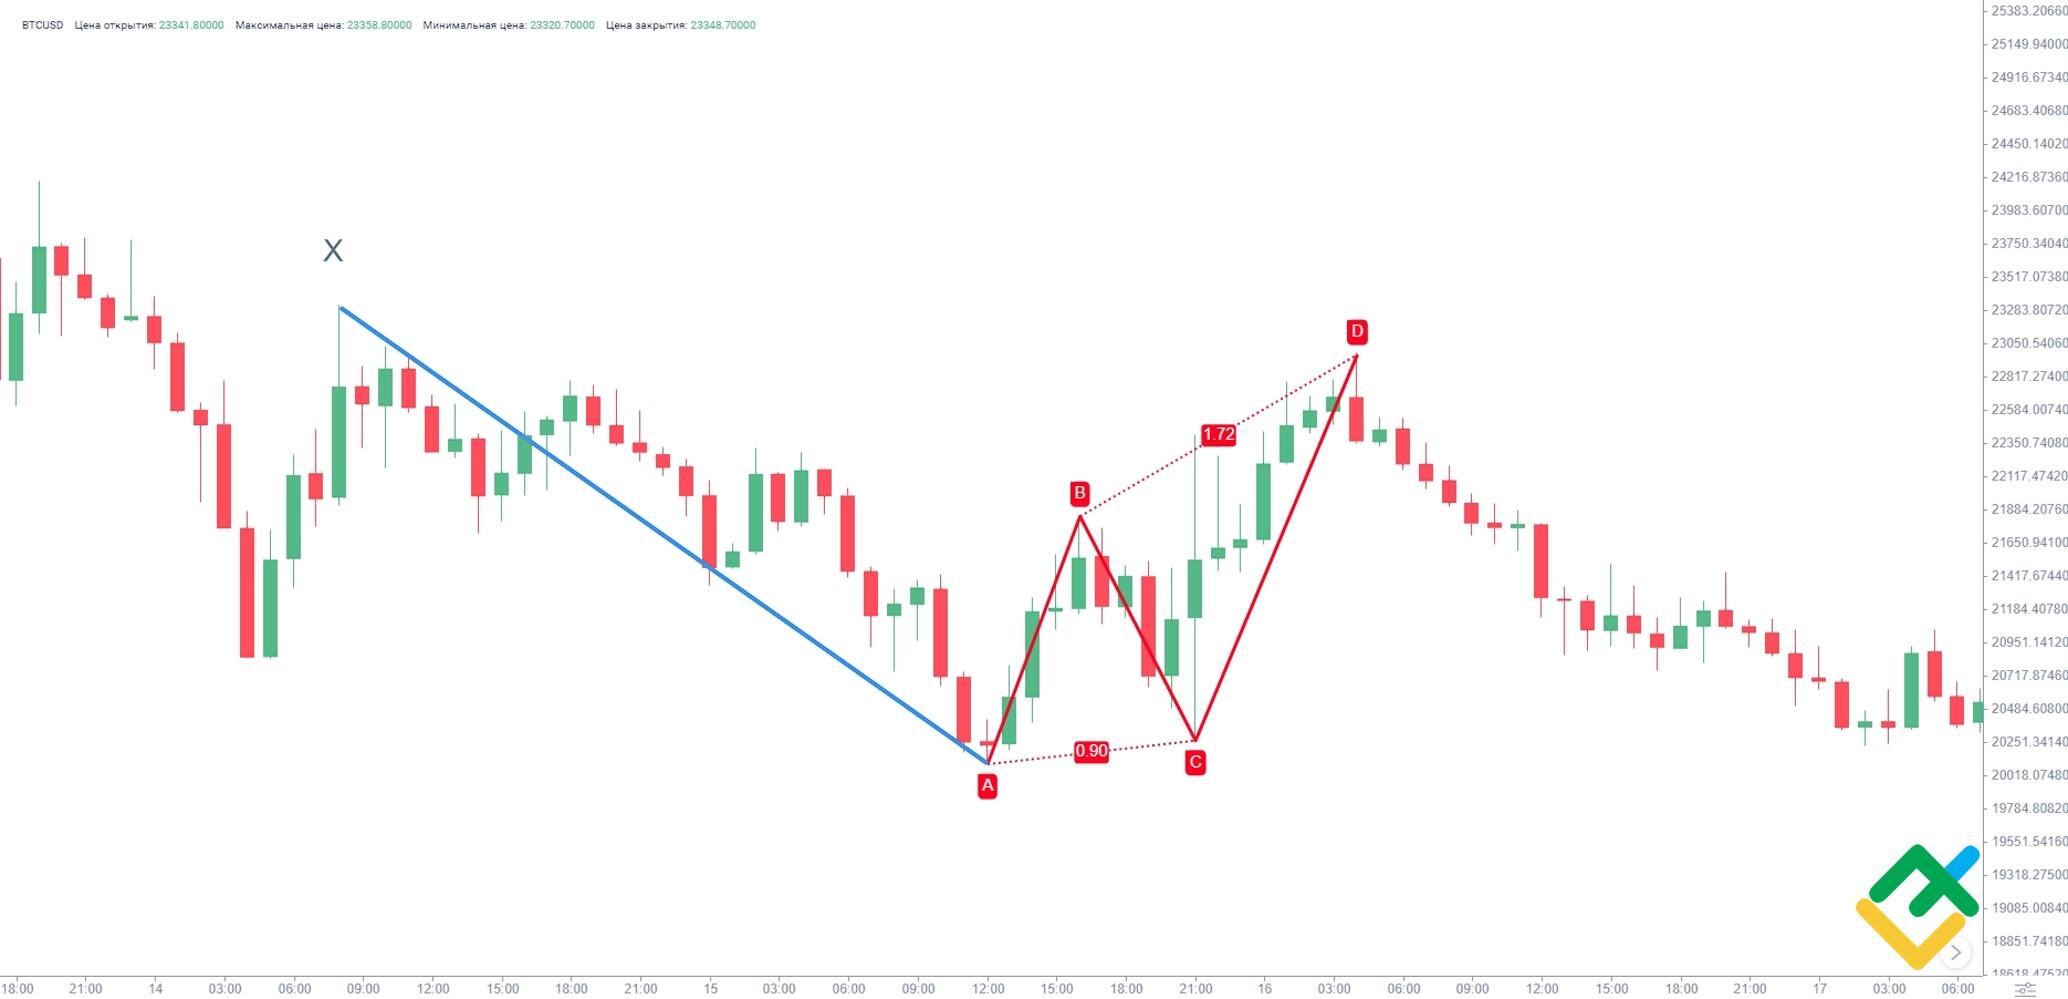
In the BTCUSD chart above, you see a bearish bat pattern. The first wave XA is the last local impulse of the bearish trend. The next AB wave drives the Bitcoin price up.
Attaching the Fibonacci extension to the XA wave, we see that AB is a little longer than 50% of the XA. The relations of other waves also meet the conditions for the Bat pattern. BC is about 88% of the AB, and CD is about 168% of the BC.
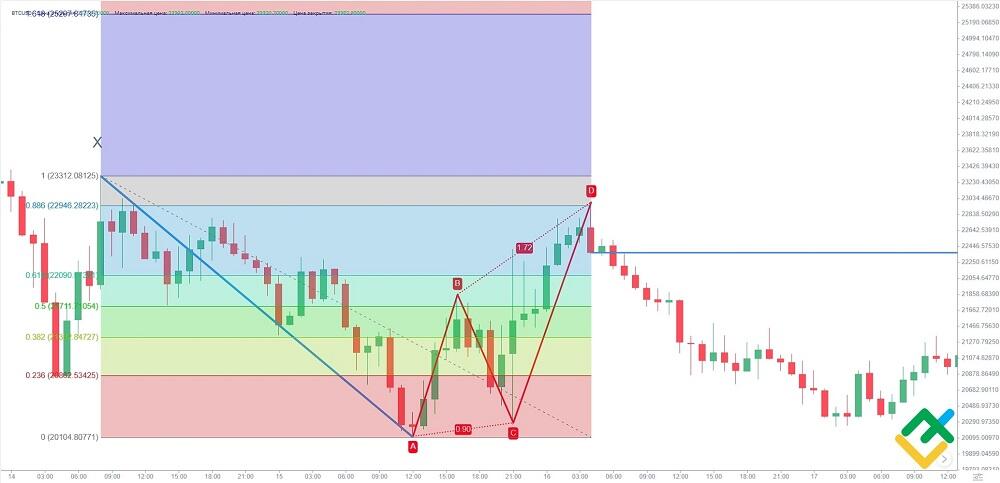
To search for a pivot point, we will use another ratio – the CD wave reaches 88% on the Fibonacci extension. As soon as the price reaches this zone, at the close of the first red candle, we open a short position – the blue line on the chart.
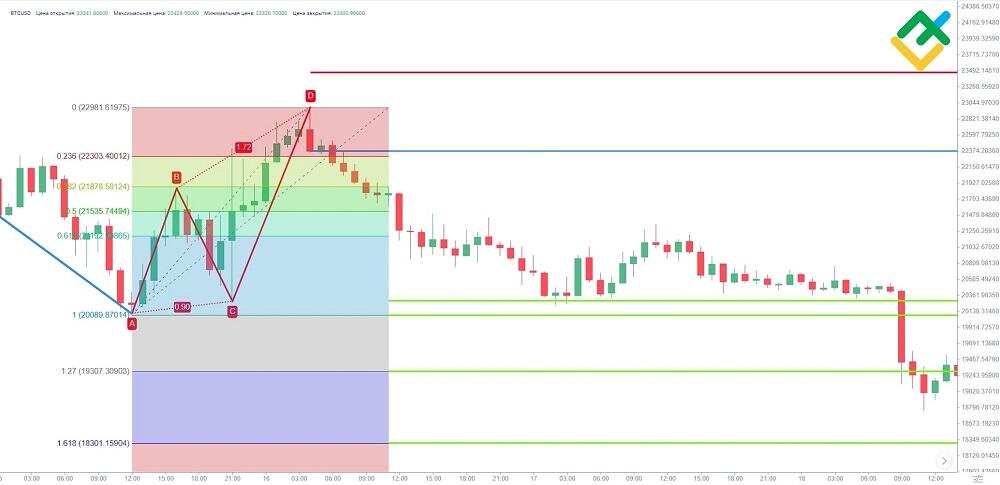
The stop loss is set just above point D (local high), a red line on the chart. Next, we mark probable targets: the first will be point C of the pattern, and the second – point A. We will set more distant targets at 127% and 161% of the AD length. To do this, we will build a Fibonacci grid, which you can see in the chart. All targets are marked with green lines.
As we can see from the chart, the price subsequently reaches the first target, after which it goes into consolidation. This is a serious sign of the bears’ weakness; therefore, it is advisable to close the position around the first target.
Trading Harmonic Patterns: Summary
By way of application, harmonic patterns are similar to classic chart patterns and Price Action patterns. This means harmonic patterns can be used in any strategy suggesting employment price chart patterns. Harmonic patterns are well combined with indicator analysis, so traders can look at the market from different angles.
More signals – more opportunities to make profits. At the same time, compared with the common price chart patterns, harmonic ones are more accurate, as evidenced by the statistics of their efficiency. Therefore, harmonic patterns should be a good supplementary tool suitable for all investors. Try trading harmonic patterns yourself and you will notice how the efficiency of your trading will go to a new level.