To create a real forex account for free, click here
They say ‘trend is your friend’, and this golden rule of trading applies to every asset on any markets. Prices do not change chaotically — their volatility is conditioned by a multitude of factors. When they coincide, certain stock market trends form. This guide will teach you to discern these tendencies and perform market trend analysis for crafting a reliable trading strategy.
What is the Market Trend? Definition & Meaning
Market trend means a certain direction of price movement over a particular period. Trends apply to all assets the cost of which is fluctuating, or when there’s a change in the trading volume.
A trend on Forex and other financial markets is usually understood as a price movement formed within a certain period of time with a clear direction and strength. Direction is the key point that characterizes market trends – traders use it to make trading decisions and maximize their income.
According to the basics of technical trend analysis, price changes are always subject to certain rules.
This fact allows successful traders to analyze the predictable price tendencies of the currencies and other market instruments. The systemic character of changes in price charts makes it possible to trade on financial markets with currencies and other investments, forecast the future price rates of assets and make the right trading decisions. Within technical analysis, there are countless indicators, advisers, and graphic patterns that serve as tools for a professional trader. Most of these tools are based on the concept of a price movement.
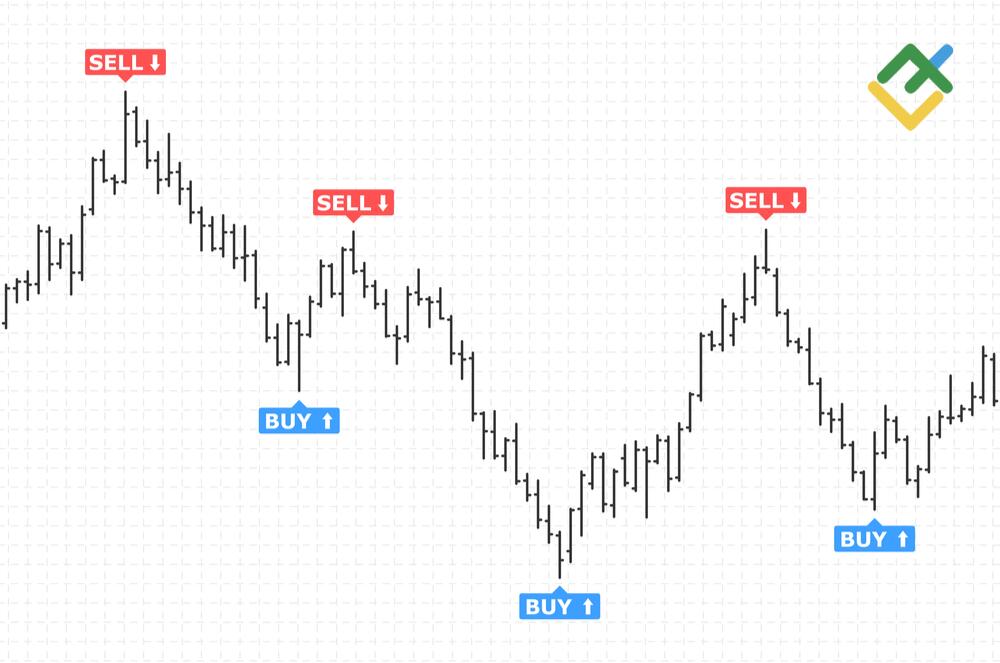
There are three major types of market trends:
- Bull market trends (upward price movement) — when prices move up. It is represented by a series of rising price highs and lows. As long as each subsequent peak is higher than the previous ones, the uptrend remains.
- Bear market trends (downward market trends) — when prices move down. Any unsuccessful attempt to surpass the previous high is an early signal of a trend reversal. A downtrend is characterized by a series of descending peaks and troughs.
- Sideways (flat markets) — the absence of a pronounced one-direction movement (this is a natural and most frequent market condition).
According to the Dow theory, trends continue until there is an unambiguous signal of their termination.
Depending on the duration, trends can be:
- Long-term (major) lasts from six months to several years.
- Intermediate (secondary, medium term) usually means a correction of the main trend and can last 1-6 months.
- Short term trends (minor) is often a correction or consolidation that lasts less than 1 month. It can be a pause in an intermediate or major trend. Also, short term trends can be revealed even on intraday charts.
Note: Do not mix up market trends with market sentiment. The latter means traders’ attitude towards the upcoming price move (their opinion does not equal real market conditions).
Trend characteristics
To identify and shape market trends, traders can use various methods and approaches:
- Direction. This property depends on the timeframe: the larger the timeframe, the less clearly the direction of the price movement is manifested. It is important to be able to distinguish between price correction and price movement. In case of the former, after some time, the price will return to its value and continue its movement within the corridor.
- Strength. The trend movement’s strength is defined by the slope of the price curve in the chart. Price spikes or steep moves are usually not very powerful, since they are short-lived. A strong and influential price movement is a consistent update of highs or lows (the slope of the price curve is approximately 45 degrees) lasting for quite a while.
- Duration. As you can guess, the trend movement is the more stable, the larger the timeframe on which it manifests itself. The duration allows the trader to evaluate its strength and reliability.
Analyzing Market Trends
To identify stock market trends, traders can use various methods and approaches:
- Fundamental analysis. That means looking at the stocks’ or their issuer’s performance in general. It allows investors to see a bigger picture of the market. For example, a trader can notice an upward movement when 1) global companies repeatedly display positive results in its financial statements; 2) economic news shows that the industry keeps evolving, interest rates, monetary policy of the country, etc.; 3) the global or local economy is on the rise together with the price of securities.
- Technical analysis. In this case, various tools are used — they are called ‘trend analysis indicators’. The most popular and widely used one is moving averages (MA). They reflect both price change direction and the trend’s strength.
- Volume analysis. With a developing trend, an increase in prices is accompanied by stable volumes or their smooth growth. A significant drop in volumes or, conversely, an unpredictable peak can be regarded as a signal of the trend finish. When the share price is moving in another direction and the volume starts growing, that means a possible reversal or correction of the trend.
One more approach worth mentioning is graphical market trend analysis, which can be regarded as a part of technical research. The most popular visual tool is a trend line. As long as prices stay above it in an upward direction or below it in a downward direction, the trend continuation is manifested.
Trend Line
If the price has been moving in the same direction for several weeks, the trader will notice that support and resistance levels are forming on a 4-hour or daily chart. But if the price direction has changed recently and a new movement is just starting to form, the borders of the trend line are hard to distinguish yet.
Irreversible trends are rare. Most often, when the price reaches support or resistance levels, bounces off it. This pullback usually takes about 30% of the main move. With this in mind, trend lines can be drawn as follows:
- If the movement is upward, a support line is drawn at the chart lows. Above and parallel to it, we can see the resistance line.
- When the movement is downward, a resistance line is drawn at the price highs, and support is drawn parallel to it.
- In the case of a flat market, a support line is drawn at the lows and a resistance line at the highs.
What you need to know about market trends
Four major factors shape market trends:
- Governments.
- International transactions.
- Assumptions / expectations.
- Supply and demand.
All of these areas are interconnected, as expected future conditions shape current decisions, which, in turn, create current direction of trends. The government influences price direction mainly through monetary and fiscal policies. These policies affect international transactions, which in turn affect business and the country’s economy. Assumptions and expectations drive prices based on the asset’s behavior and its future prices. Ultimately, changes in supply and demand create trends as market participants compete for the best price.
Dow’s theory also defines some of the major factors that you should keep in mind:
- The trend will continue rather than finish or reverse.
- The stronger the trend, the more likely it is to continue.
- The trend can end at any time.
- If a trend lasted or continued under certain conditions during the past performance, this does not mean it will form or occur under the influence of the same situation.
How to find & identify market trends?
Now, as we explored the theory, let’s move on to the practical part. You don’t need to possess huge trading experience to spot trends in the stock market. The market analysis boils down to tracking the dynamics of price highs and lows. Here’s how it works.
Uptrend
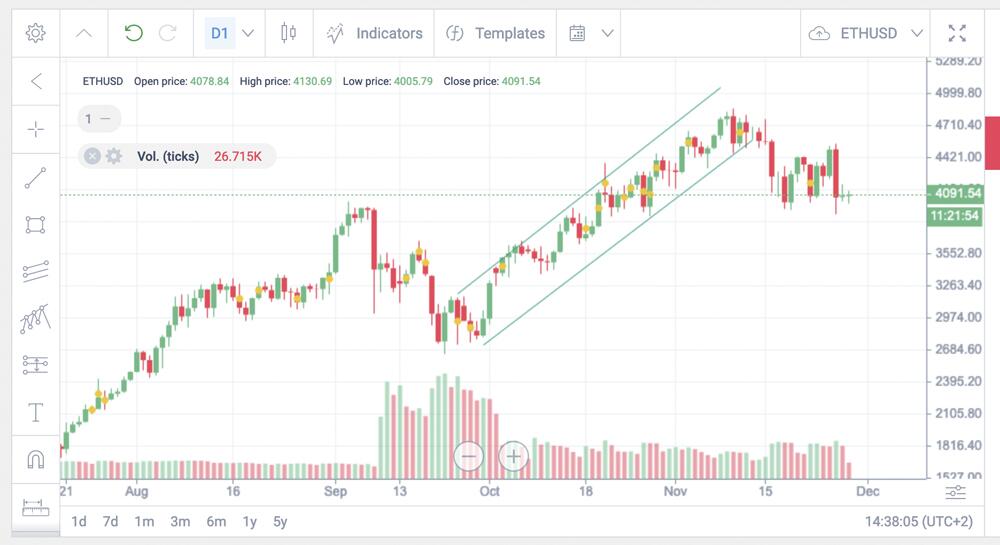
An uptrend (bullish trend) is a price movement in an upward direction, where each subsequent maximum is higher than the previous one, and each subsequent low is higher than the previous ones.
This movement is clearly visible on currency charts: it is a curve that tends to reach new highs at a certain time interval.
An upward price direction implies a gradual increase in the price over a certain period. It’s crucial to perform a market trend analysis concept only concerning a given time interval because the particular direction of the trend even on adjacent time frames can be opposite.
Since there could be bull markets and bear markets, traders should learn to determine whether this trend is natural or a result of an overestimated demand for currency.
Downtrend
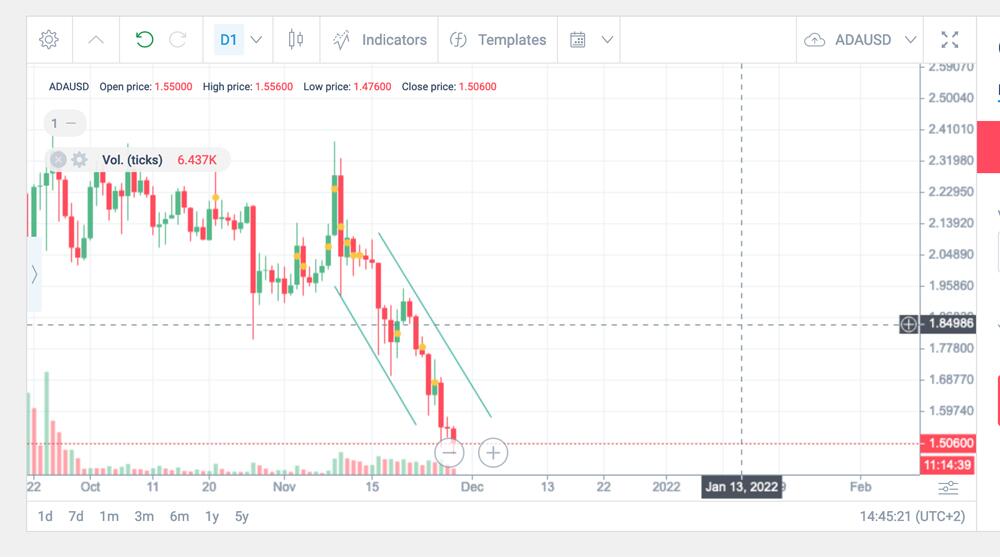
A downtrend (bearish trend) describes the movement of a stock to a lower price than previously. It will exist as long as there are lower highs and lower lows on the stock chart. A trader can potentially save money if he decides to sell a falling stock. At the same time, other traders seek to capitalize on the downward price moves by buying and selling short. A downtrend can be identified using trend lines and the moving averages.
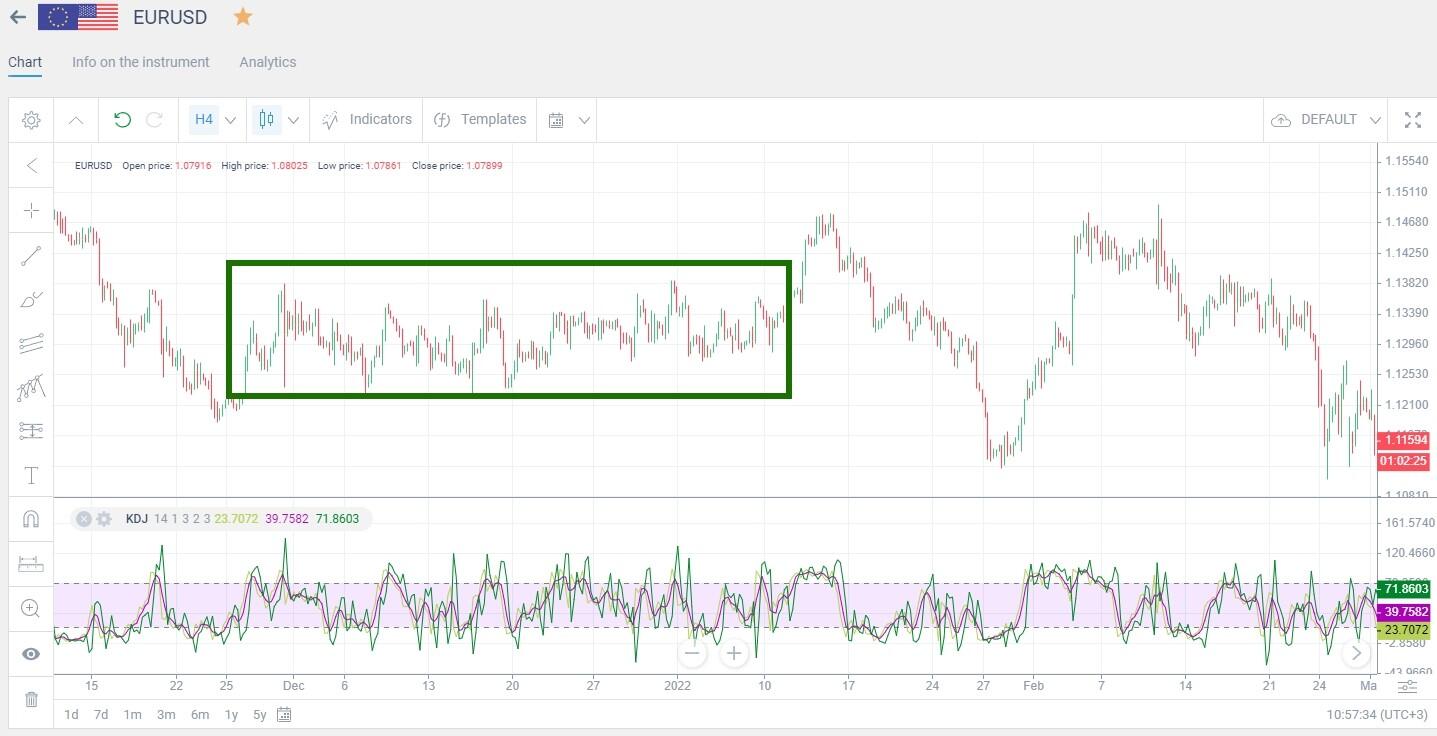
Sideways trend
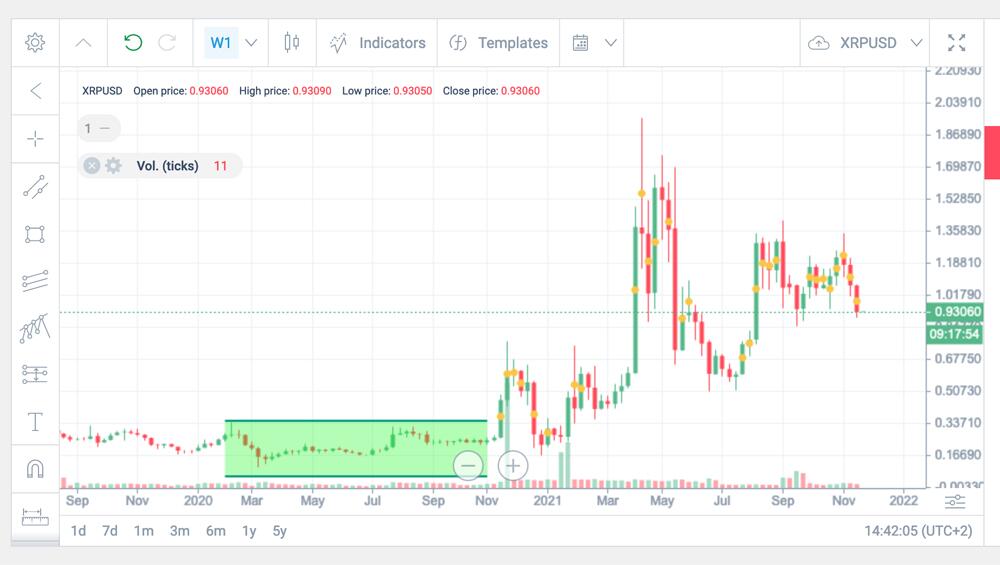
A sideways trend is also referred to as a flat, which means a neutral trend, when the price of an instrument moves up and down in a certain price range.
In other words, a sideways trend, or flat, on Forex is manifested in the price chart as highs and lows located sequentially at approximately the same level.
You can see an example of a sideways trend in the EURUSD chart below:
Intermediate Trends
As we have mentioned earlier, intermediate trends are the time of correction. That means an asset’s price can go in any direction, even an unexpected one. How to reveal an intermediate trend? It usually happens when you see a stock’s price making sudden rallies and turnarounds without establishing any clear uptrend or downtrend. Such a situation can last for several weeks or even months leaving traders embarrassed (which also causes market participants to sell or buy chaotically).
Pretty often, intermediate trends are triggered by some political or economic actions and news. History shows that:
- Rallies in a bull market are strong, while reactions are weak.
- Rallies in a bear market are weak, while reactions can be strong.
- Each market (bear or bull) will have at least three intermediate cycles, each lasting 2-8 weeks.
Long-Term Trends
According to analysts, a long-term price trend continues from six months to five years. It is also commonly called the ‘main’ or ‘primary’ trend. Note that it is formed from mid-term tendencies which can be in opposite directions.
For graphical and technical analysis of longer-period trends, traders use weekly and monthly timeframes. Longer trends are of interest to large market participants and investors who prefer holding assets for several years (on the equity market, for instance).
But even if you trade mid-term, knowledge about the current long-term trend can help you compare data obtained from different timeframes. Besides, it comes into play when you work with multiple analytical tools and need to align the information and make decisions within shorter periods. Significant events and the global economy can impact the asset price at any moment, but long-term price movement usually prevails despite what happens on the market.
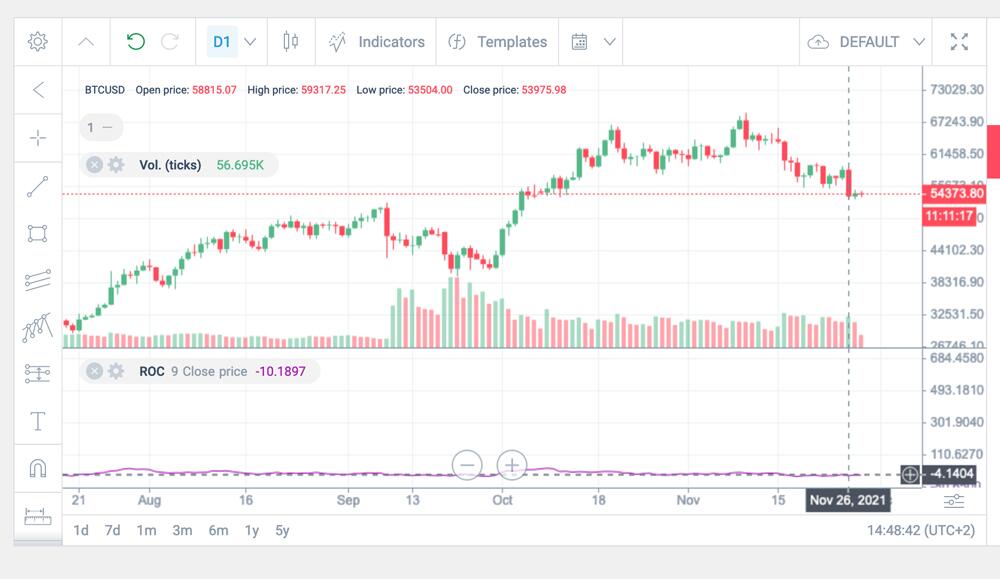
To determine a long-term trend, many investors usually combine a stochastics indicator and ROC (Rate of Change). The latter is calculated by the following formula:
ROC = (Pt / Pt-n) x 100%
Pt — current position price;
Pt-n — the price of a similar position some time ago.
When analyzing long-term trends, traders usually apply ROC to 26- or 52-week timeframes, as shown in the chart above.
How to understand if a stock market trend is valid?
For making more precise forecasts, you should be able to use reliable instruments and approaches to perform market research. Here are the tools that traders often exploit to test their theories.
With a trend line
A trend line is drawn on a price chart by connecting at least two extreme points following each other in one-directional movement (up or down). Having laid a parallel straight line, you form a channel within which the price moves.
How to determine the trend using this tool? The asset price will move somewhere between these lines. Thus, when the cost is moving up, you should play long (count on price increasing), and when it’s moving down — trade short (the current stock price is expected to decrease).
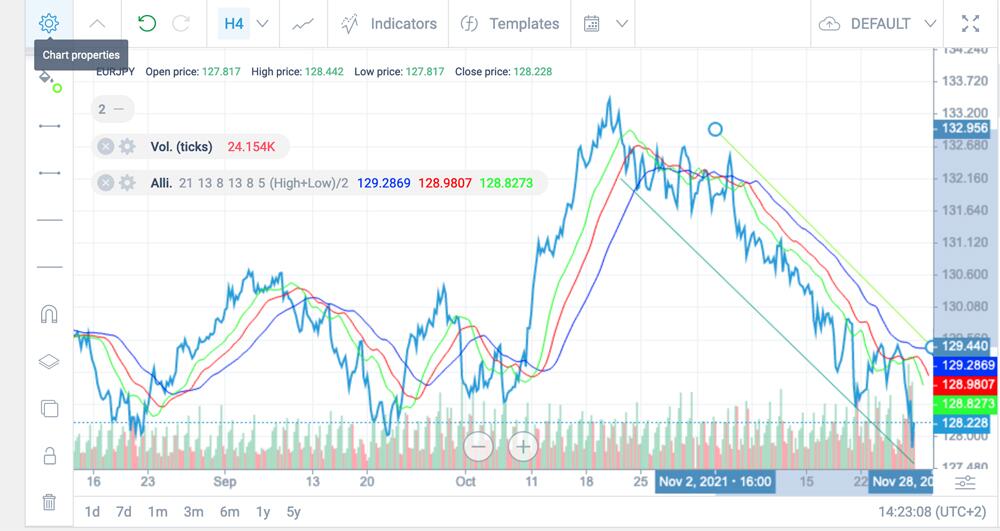
With a moving average
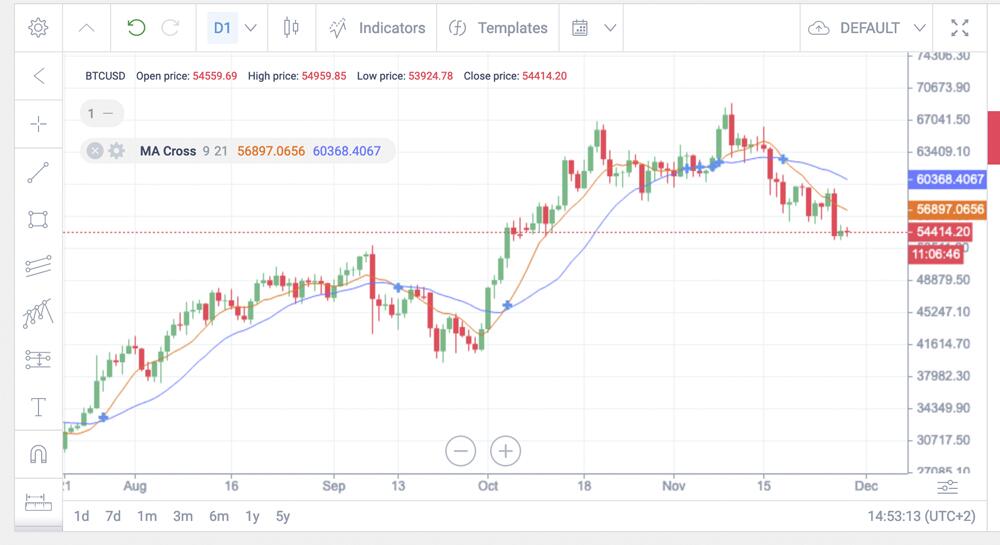
The MA is often used together with a trend line to get a more objective and fair view. The price always moves near its average value but can deviate in one direction or another.
If yesterday’s closing price is above the purpose MA (see the chart), an uptrend is coming. If yesterday’s closing price is below the same MA, an asset is likely to lose value.
The orange middle line is used as a confirmation signal. If the price closes above the weekly average, the market will continue to move up for quite a long time afterward, in the opposite case — the market will experience a downtrend. Despite its reliability, the Moving Average indicator can be lagging, which makes it less suitable for medium time frames and short-term trading.
With horizontal volume
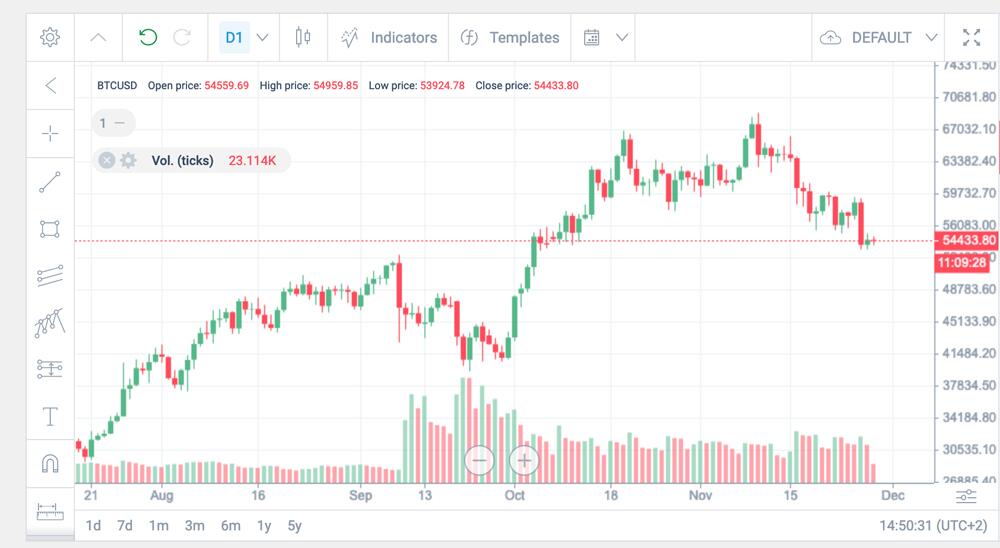
By analyzing the horizontal volume, a trader can determine the value zone and understand where the price is relative to a given level. The trading volume is interpreted the following way: if the price level is above this zone, you should purchase in the mid-term, if the price is below the zone — assets should rather be sold.
You can stick to this direction as long as the price zone does not move, i.e. no volume will be accumulated and exceed the volume of the previous value zone. When enough volume gets collected, stocks gain momentum, and the trend either continues or reverses.
Know Market Trends Before Buying!
To trade on the stock exchange successfully, you should be aware of price tendencies: they reflect traders’ mood and show you the right time for entry or exit. Try to view a broader picture: you should pay attention to both news and the asset’s performance. Technical indicators coupled with market research bring the best trading strategies.
To create a real forex account for free, click here