To create a real forex account for free, click here
The method of graphic Japanese candlestick chart analysis is the oldest method of technical analysis. It was developed by Japanese merchants in the XVIII-XIX centuries. The psychology of market participants’ behaviour and market sentiment is determined by the supply/demand ratio, which, in turn, affects the price movements. As a rule, the asset prices move in cycles, because people behave similarly in certain situations.
This article will help you understand trader psychology and analyse candlestick chart patterns to trade in financial markets successfully.
The article covers the following subjects:
- What Is a Candlestick Chart?
- Candlestick vs. Bar Charts
- How to Read Candlestick Charts?
- Types of Candlestick Patterns
- Hammer
- Inverted Hammer
- Spike
- Bearish Engulfing Pattern
- Bullish Engulfing Pattern
- Bearish Harami
- Bullish Harami
- Bearish Harami Cross
- Bullish Harami Cross
- Bullish Rising Three
- Bearish Falling Three
- Candlestick patterns chart analysis
- Example of candlestick patterns trading in Forex
- Conclusion
What Is a Candlestick Chart?
A candlestick chart is a style of financial price chart organized as candlesticks representing price movements over a particular time.
The meaning of candlestick analysis lies in the name itself. The principle of a graphical illustration of price action is a sequence of candlesticks, which define the market sentiment and price direction in different periods, from one second to one month. Besides, you can determine the high and the low of each candlestick. A complete candlestick also displays the opening and closing prices. A combination of these data provides information for making trading decisions when using candlestick chart patterns. The Japanese candlestick chart is a universal tool, one can apply candlestick chart analysis to trading currencies, stock markets, commodities, CFDs, cryptocurrency, or any type of trading asset.
The concept of candlestick charting was developed by Munehisa Homma, a Japanese rice trader. He combined four indicators, based on which one could predict future demand quite accurately. Homma was the first to develop an original trading system that determined entry and exit points.
Originally, a rising bullish candle was white and a falling bearish candle was black. With the development of technology and the advent of multifunctional trading terminals, traders and investors have the opportunity to paint candlesticks in the colors that suit them.
Candlestick analysis is popular among traders and investors for a variety of reasons, including:
- Japanese candlesticks can be used by both professional traders and beginners because they are universal;
- Japanese candlesticks have original and catchy names for various types and combinations, so they are easy to remember;
- Candlestick analysis has existed for several centuries, thanks to which it has been improved to a certain degree of accuracy;
- Candlestick analysis can be easily combined with other types of technical analysis, which increases the chances of making a profit.
Candlestick vs. Bar Charts
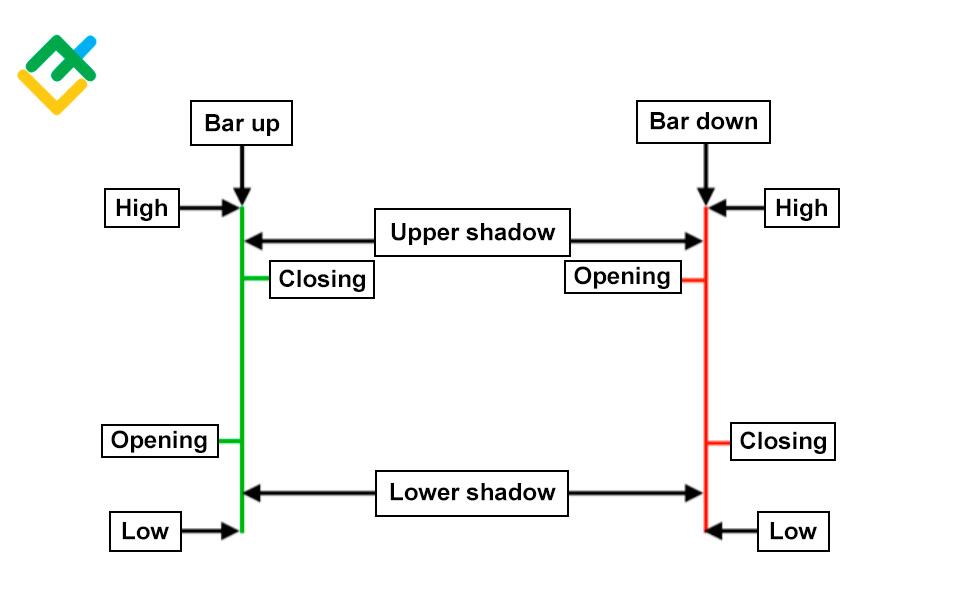
The main difference between candlestick charts and bar charts is the presence of the so-called “body” in the Japanese candlestick, which makes the candlestick charting more expressive.
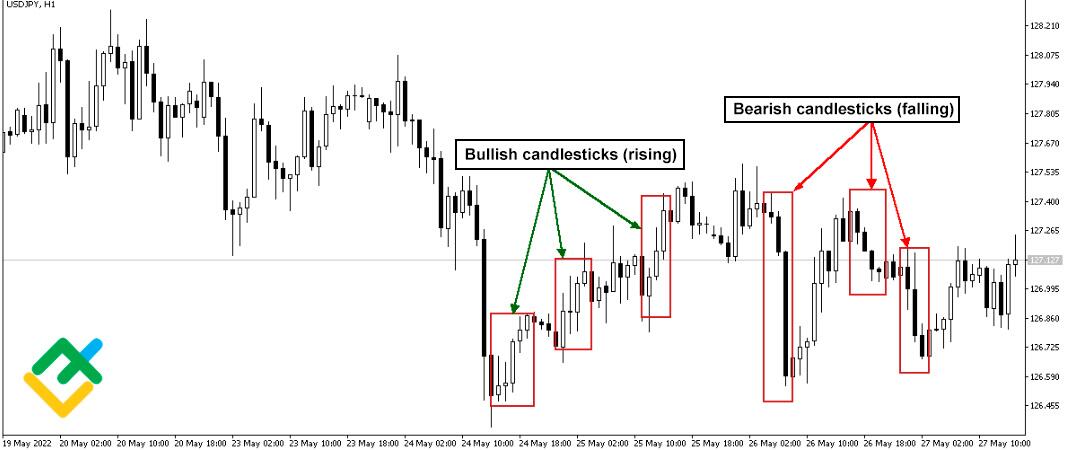
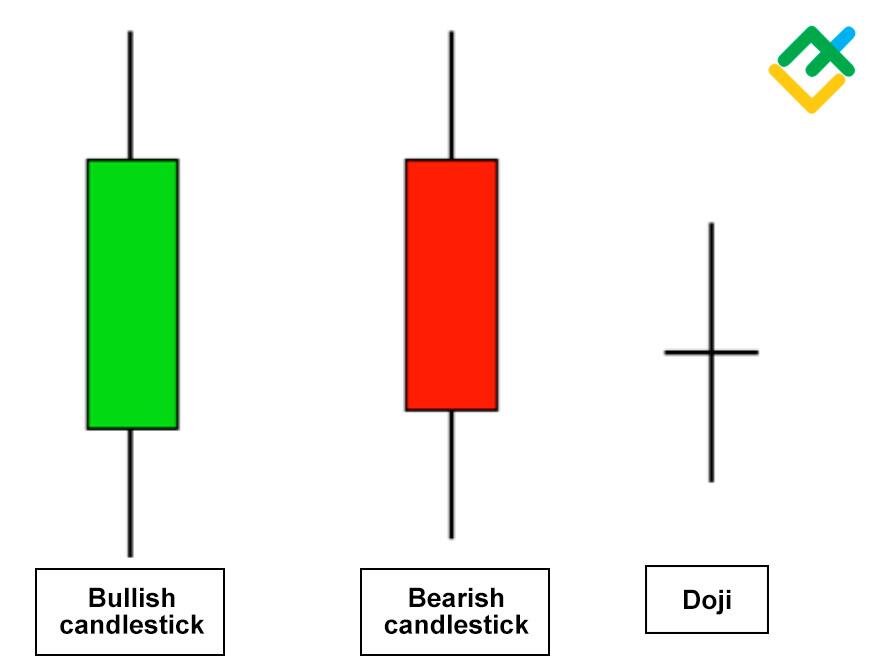
As a rule, bullish candles, showing the price rise, are white or green candle; it demonstrates opening and closing levels.
The bearish candle is usually black (or red candle), meaning the price decline. This candlestick shows opening and closing prices.
Upper shadows and lower shadows show the high and low prices.

A bar chart is a similar tool for price data analysis, which forms vertical lines.
The upper shadows and lower shadows mark the price high and low.
The horizontal lines on the side of the bars show the opening and closing prices over a particular period.
If the opening price is less than the closing one, the bar is bullish. If the opening price is higher than the closing one, the bar is bearish.
In general, candlesticks and bars show the same information for a particular time:
- Price high;
- Price low;
- Open;
- Close.
This information helps traders:
- Determine the trend direction;
- Spot good entry and exit points;
- Predict the upcoming price reversal;
- Measure the volatility and monitor other market sentiment changes.
The difference between bars and candlesticks is a different classification and terminology since bars were developed and used in the West.
How to Read Candlestick Charts?

Candle charts are a technical tool that reflects the dynamics of the price of various financial instruments in the stock, currency, cryptocurrency, and commodity markets.
The key motivation for traders is the opportunity to make money. To do this, each market participant must be able to analyse price movements and understand trader psychology. A candlestick chart is a convenient and practical tool that displays price changes, thanks to which traders and investors can easily define the trend direction.
The candlestick represents information about the price action. For example, a red candle or black candlestick means the bears are dominating at the specified time. A green candle or white candlestick means that the bulls control the market.
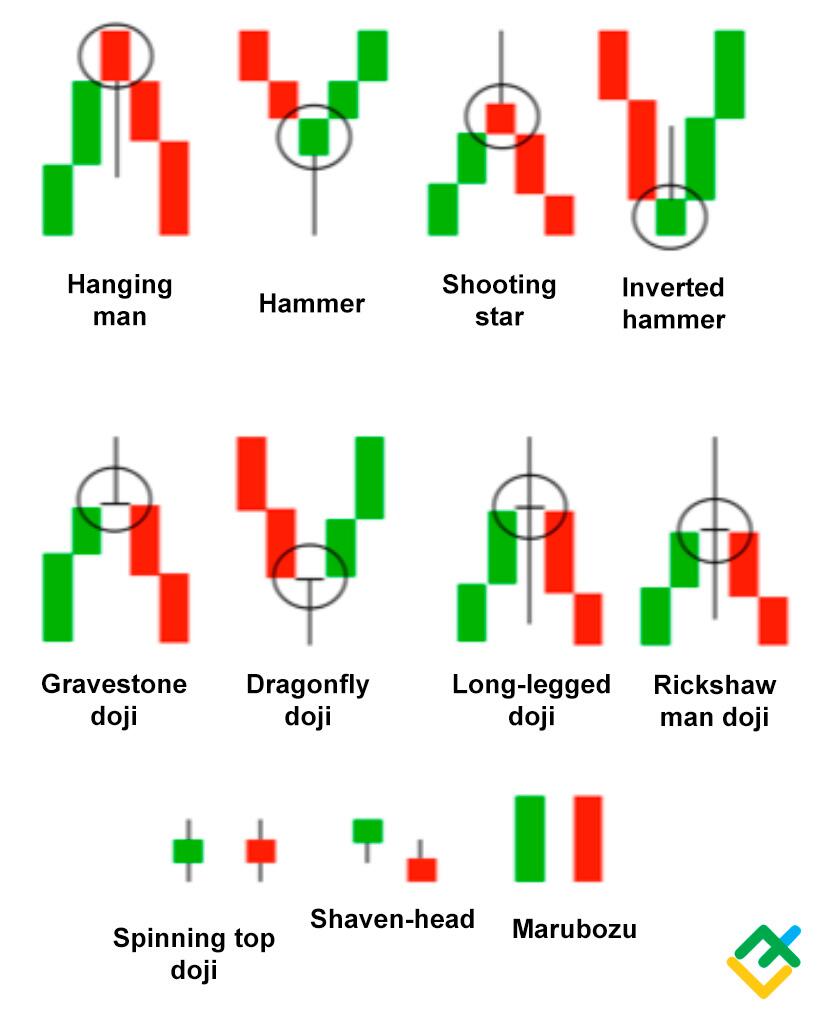
There are also Doji candlesticks that mean market uncertainty. Doji often appears when the market is in the overbought/oversold zones, being a reversal candlestick pattern. There are several types of doji candlestick patterns, such as Gravestone, Dragonfly, doji with a long upper shadow or down shadow, Rickshaw man doji candlestick, and a Tri-star.
When analysing a candlestick chart, it is also important to take into account the time intervals of emerging candles or the so-called timeframes.
Timeframes range from one minute to one month. Short-term timeframes, 1 minute – 30 minutes, are more vulnerable to market noise, including small corrections and intraday volatility. The longer the timeframe, the more accurately you can determine the trend and japanese candlestick charting techniques work more efficiently. This is due to the fact that candlesticks formed in shorter time frames can be just a shadow of a candlestick in a longer time frame.
Let me give an example of the UKBRENT chart.
The 30-minute chart on the left shows the highlighted area of action of one candlestick in the daily timeframe on the right.
In a shorter timeframe, we see an evening star bearish reversal pattern, with a hanging man pattern inside.
Looking at a 30-minute chart, a newbie would sell and lead to losing money rapidly, while an experienced trader looking at a daily chart would see a bullish flag price candlestick pattern forming, with a bullish momentum daily candlestick.
This candlestick was a signal for a soon breakout of the flag, and the trader, having waited for the correction to finish, would open a buy position and make a good profit.

However, the candlestick trading strategy is very important. Trading strategies are short-term, medium-term, and long-term. In the first case, one could use a high-risk day trading strategy, combining Japanese candlestick analysis and candlestick price action patterns. In the second case, one trades more conservatively and position could be closed in a week, but the profit from one trade would be higher.
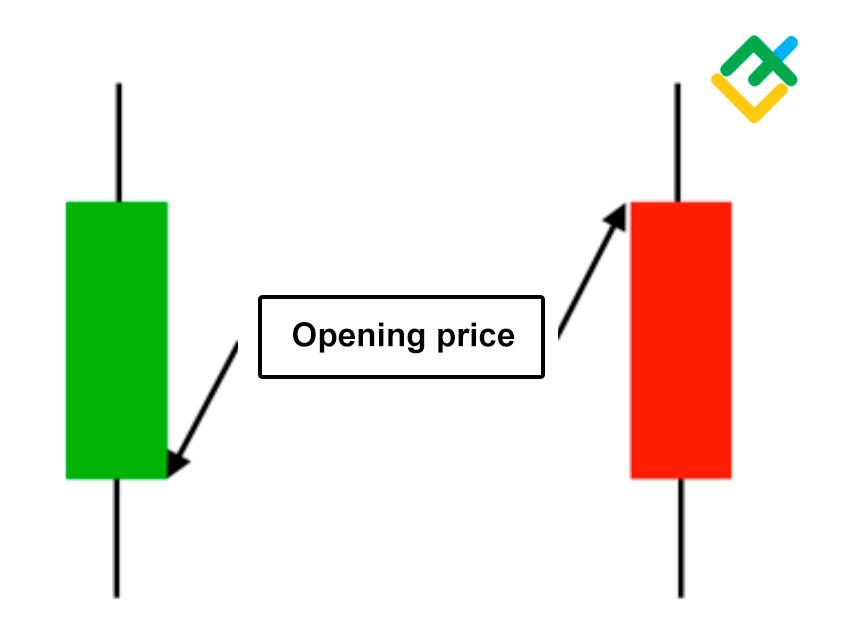
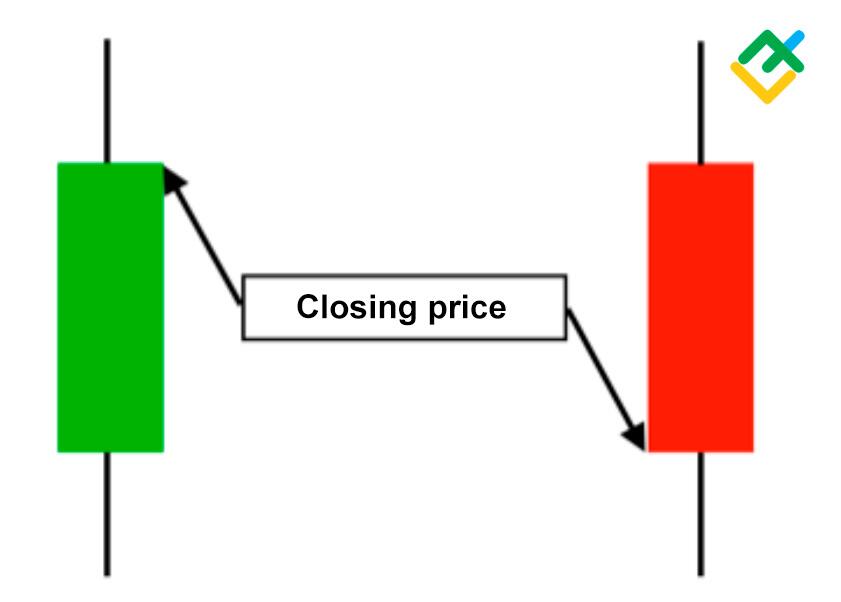
Open Price
The opening price is the price level where the movement started in a new period. If the price is rising, the candlestick will be green or white. If the price is going down, the candlestick will be red or black.
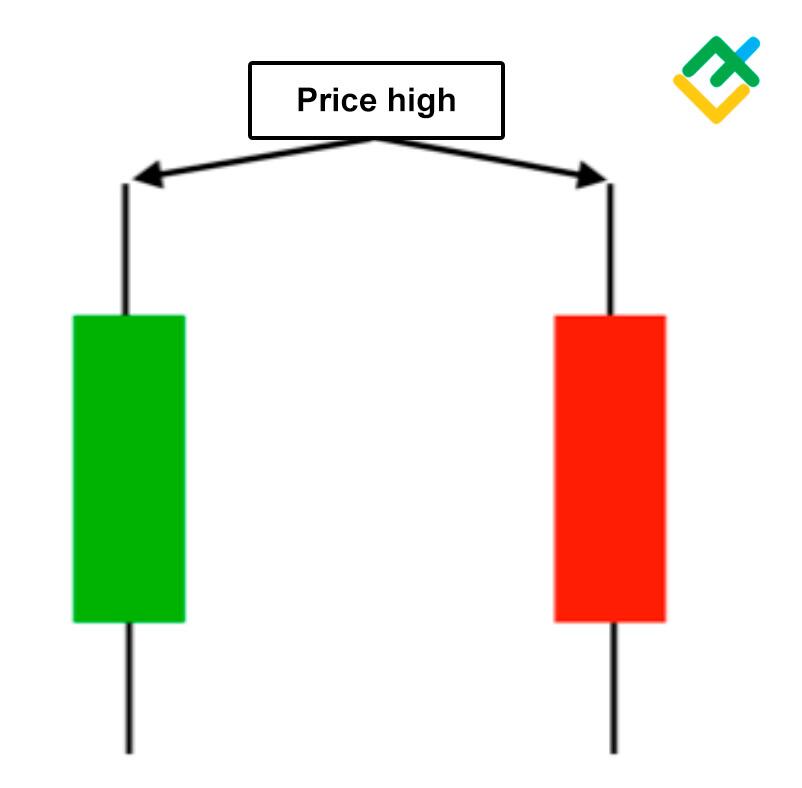
High Price
The price high is the highest price level reached over the period. It is marked by the candlestick shadow. If there is no shadow, the open or close prices are the highest over the period.
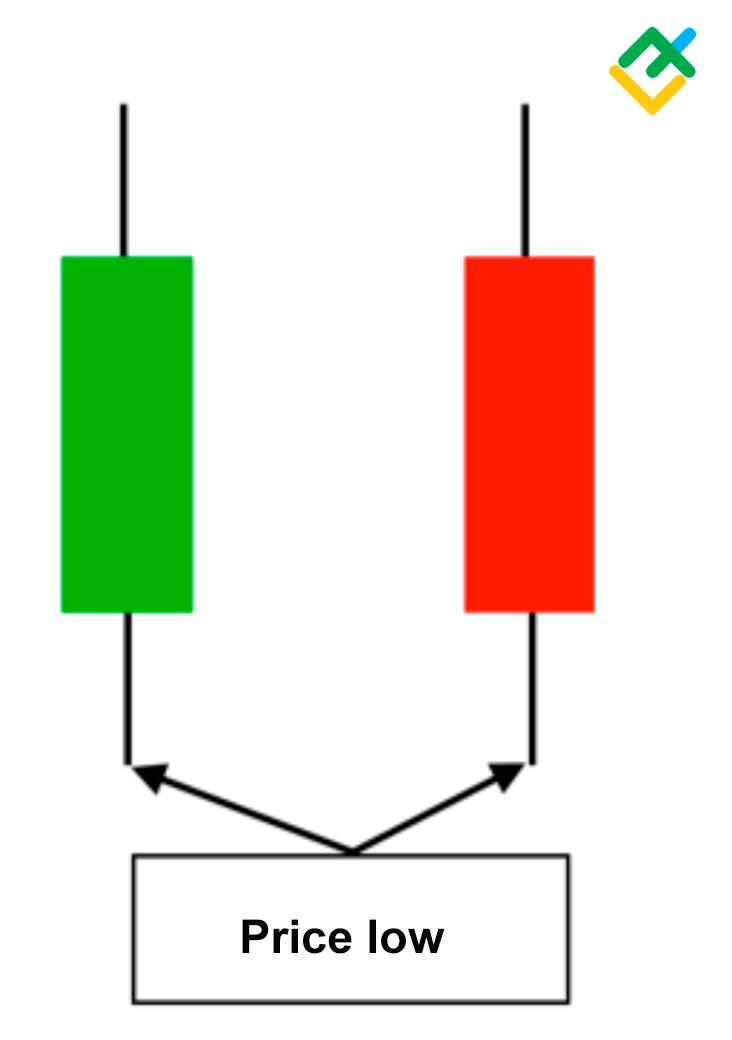
Low Price
The price low is the lowest level hit by the price in the candlestick; it is marked by the lower shadow. If there is no shadow, the lowest price is at the opening/closing level.
Close Price
The closing price is the final price of the candlestick formed over the period. The candlestick is green or white if the closing price is greater than the open price. If the closing price is less than the open price, the candlestick is red or black.
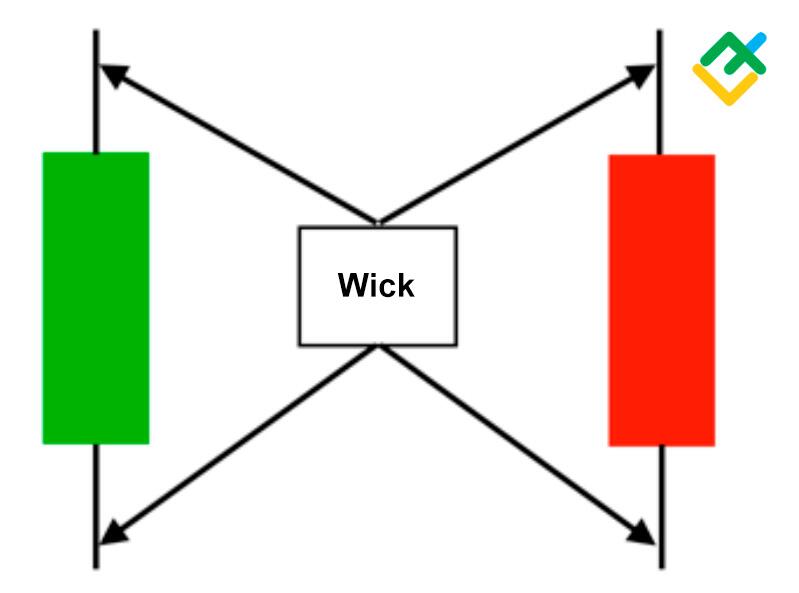
The Wick
The candlestick’s wick is the same as the shadow. The wick of the candlestick represents the price high and low over a particular period. There can be a top wick or a down wick. The length of the candlewick shows the price volatility.
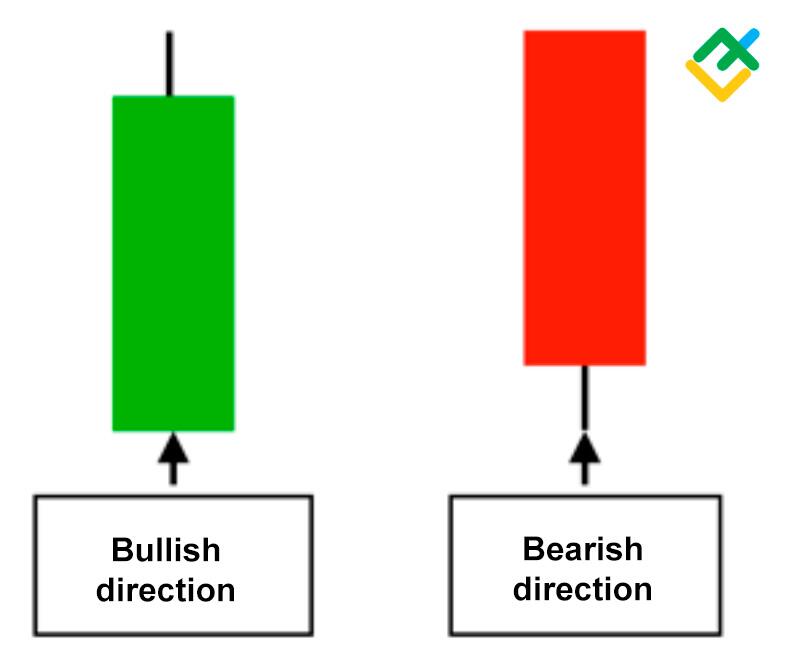
Direction
The price direction is the price movement line indicated by the candle body. The candlestick colour shows whether the price falls or rises. If the candlestick is green or white, the price is up. If the price goes down, the candlestick will be black or red.
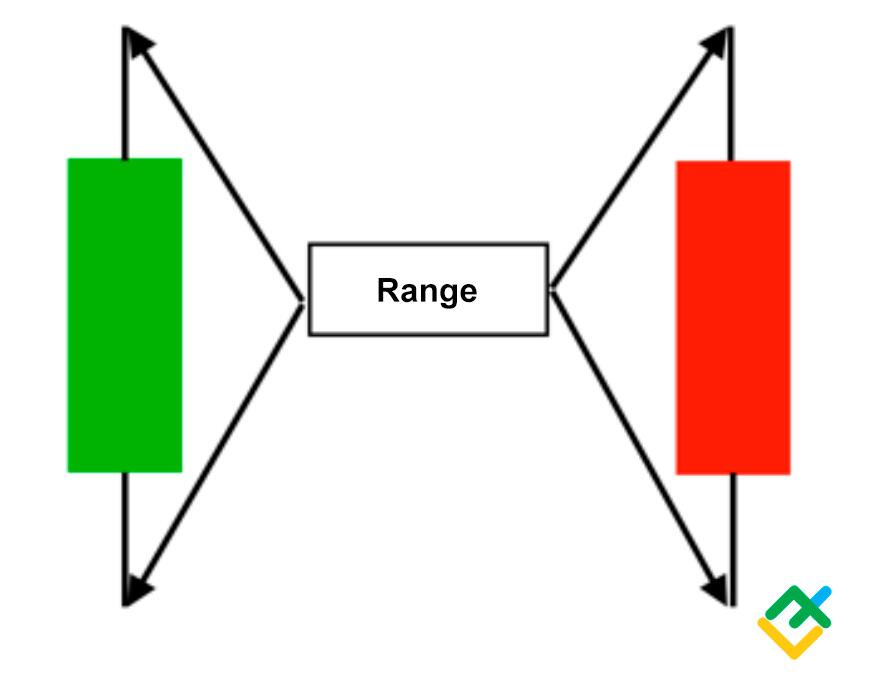
Range
The candlestick range is the distance between the highest and lowest price.
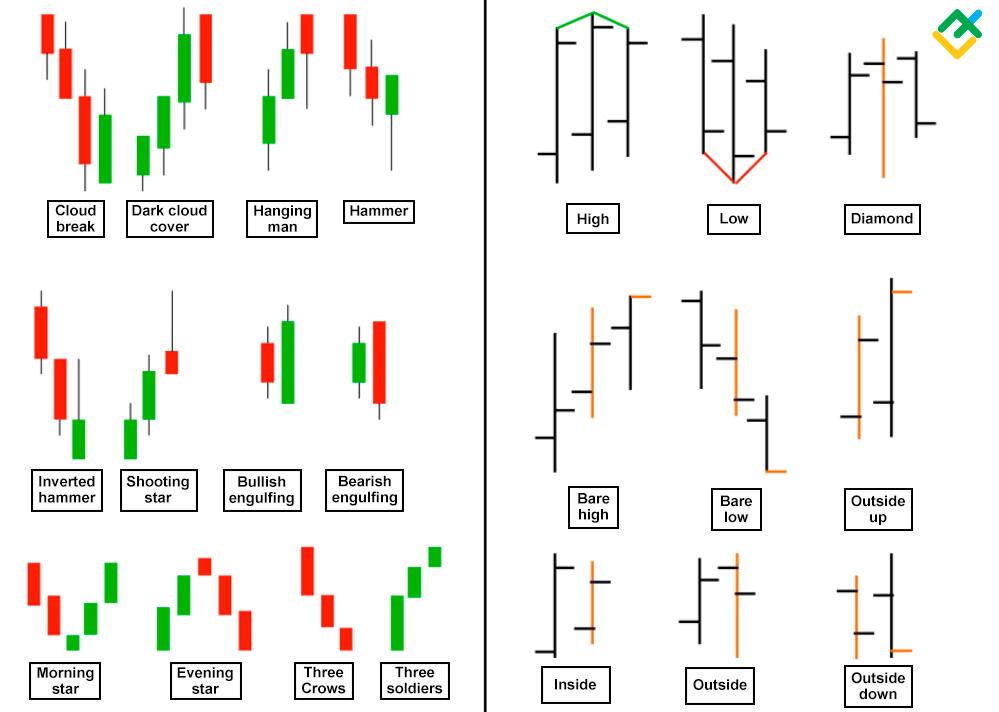
Types of Candlestick Patterns
There are different types of candlestick chart patterns, composed of one or several candlesticks.
Below, I will describe basic types of candlestick chart patterns.
Single Candle Pattern
As you see from the name, a single candle pattern is composed of one candlestick.
Single candle pattern can signal a trend reversal. For example, a hammer candle, an inverted hammer, a hanging man, a shooting star, a doji, and others.
There are also continuation patterns, signaling the ongoing trend to continue.
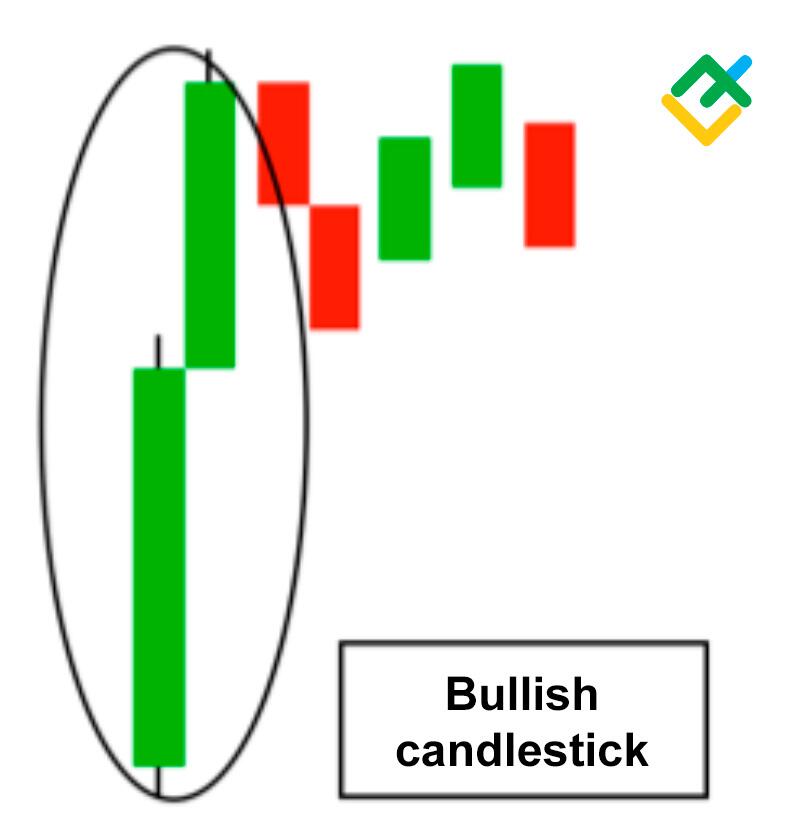
Bullish Candlestick
A bullish candlestick is a full-body green or white candle with a wide range that can have short shadows. When a bullish candlestick appears, it means a sharp increase in the number of asset purchases, suggesting one could enter a long.
As a rule, such candlesticks appear in price candlestick patterns like a bullish flag or pennant.
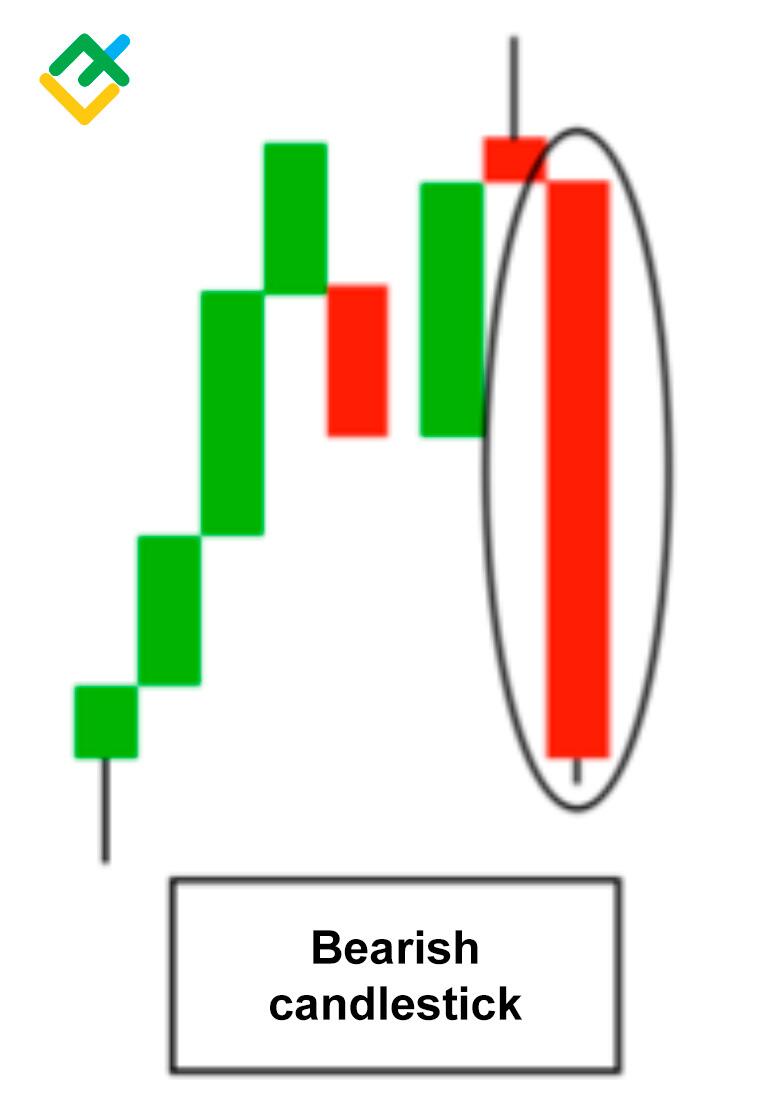
Bearish Candlestick
Bearish candlestick is a full-body red or black candle directed down; it can have short wicks.
Such a candlestick means the number of sell trades has increased, and one could enter a short trade.
Most often, such candles appear within bearish flag or pennant price patterns.
Double Candle Pattern
Double candle patterns consist of two candlesticks. Based on how the candlesticks are located, you can anticipate the future price movement.
For example, such candlestick patterns as engulfing candlestick, dark cloud cover, cloud break, are strong reversal patterns, signaling that the ongoing trend is to reverse soon.
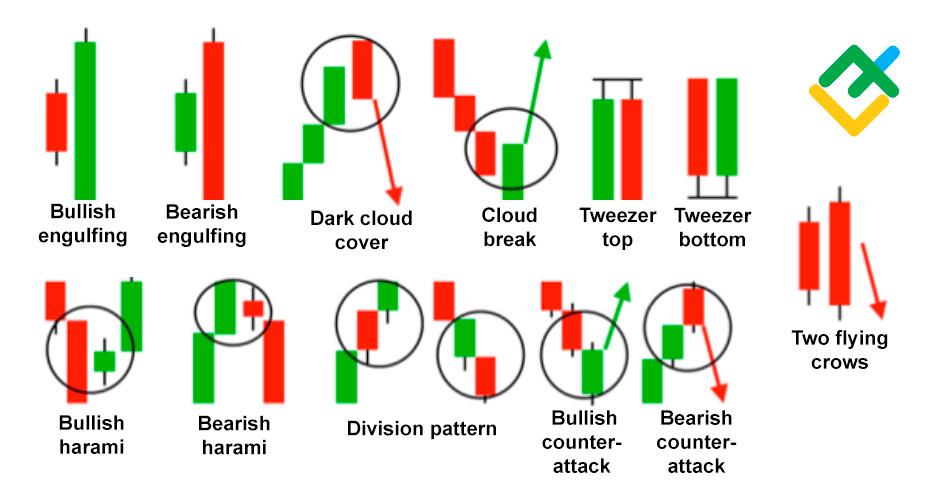
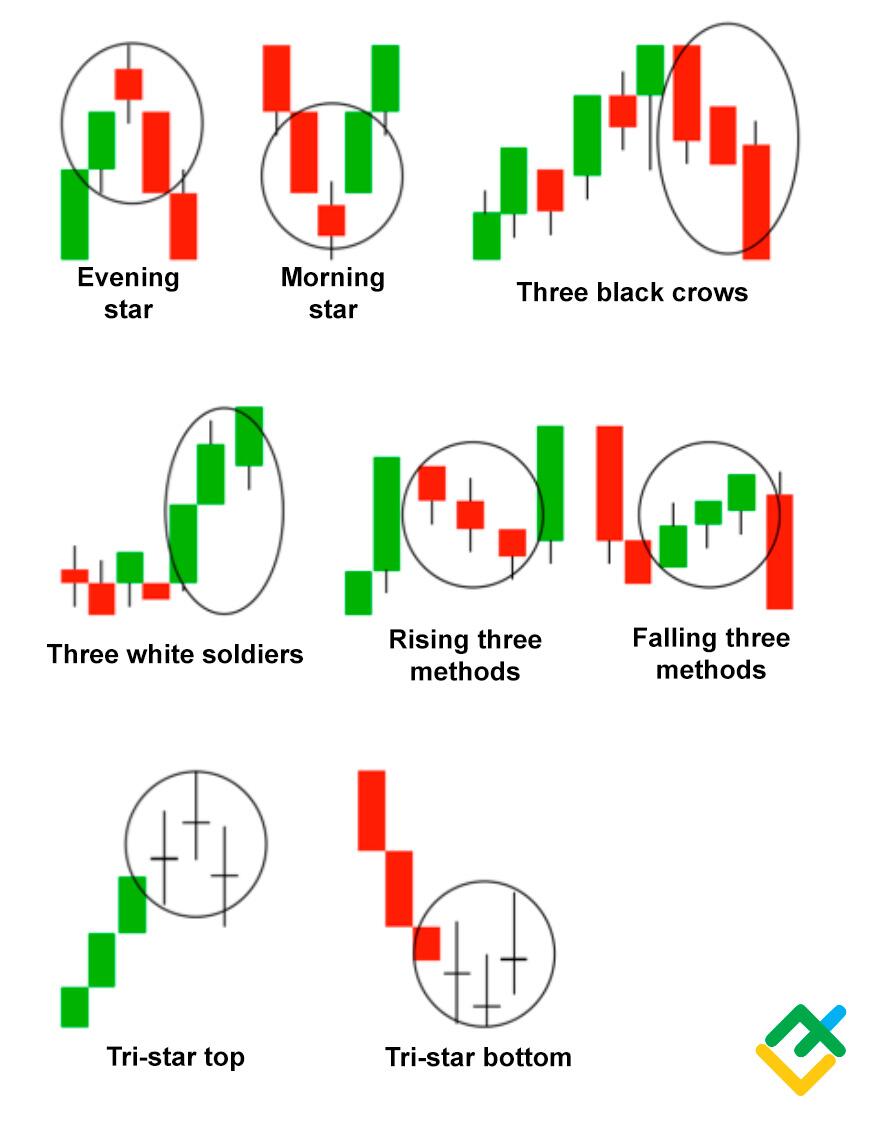
Triple Candle Pattern
Triple candle patterns is composed of three candlesticks. The most common reversal patterns are a morning star, an evening star, a tri-star doji top, a tri-star doji bottom, three black crows.
Continuation candlestick patterns are three white soldiers, rising three methods, and so on.
Hammer
A hammer pattern in candlestick analysis is a classical single-candle reversal pattern. A hammer candle at the low of a downside momentum signals a downward trend reversal up, suggesting the price should be rising.
The Japanese name for this pattern is takuri. Takuri means bottom groping, because the candlestick body is short and the lower shadow is long.
When a hammer forms at the high, following a long uptrend, it means the trend should soon turn down. At the top, a reversal pattern is called a hanging man.
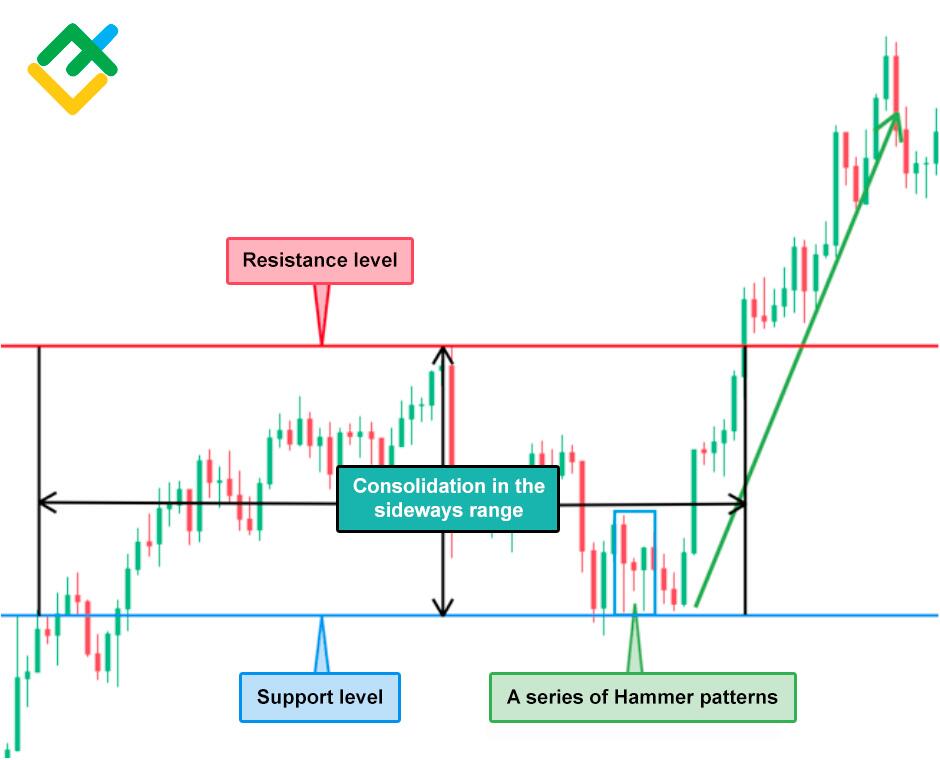
A hammer pattern helps traders define the potential reversal zone.
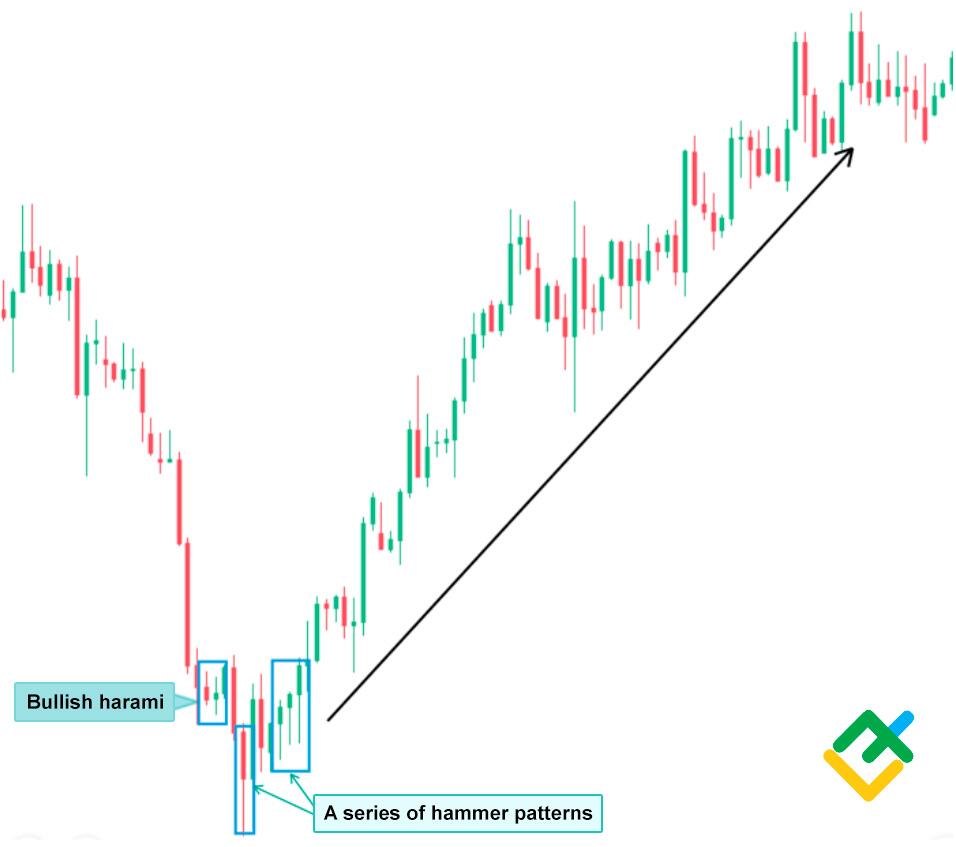
You see from the BTCUSD daily chart below that, following a long consolidation in a sideways channel, the price has formed a key support level. A series of bullish hammer candle patterns appeared there, following which, the market reached a new price high.
Inverted Hammer
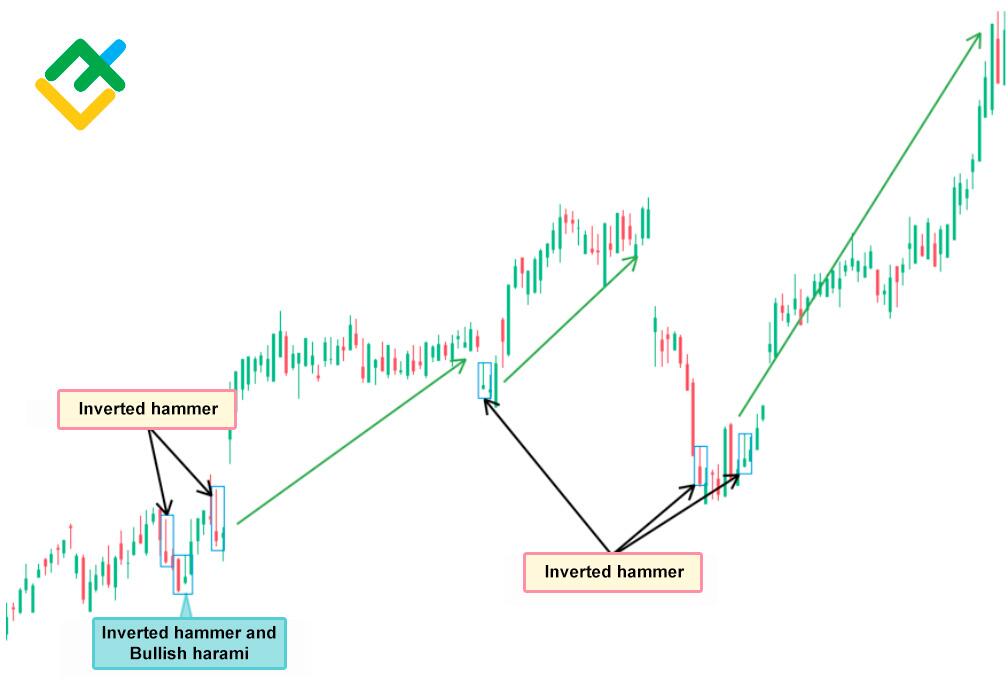
An inverted hammer is a candlestick with a short body and a long upper wick. This is a reversal pattern that usually forms at the low following a downtrend.
The same candlestick at the high is called a shooting star; it signals a soon trend reversal down.
Before you enter a buy trade, make sure the inverted hammer candle is bullish. The bullish sentiment can be confirmed by other candle patterns, like engulfing candlestick, hammer, three white soldiers, and so on.
Spike
A spike is a single candlestick pattern, with a small or no body and a long wick up or down.
A pattern is tradable as a spike if the candlestick’s body is smaller than the wick by at least ten times.
I recommend analyze such patterns in the daily chart and enter a trade after the next candlestick, following the spike, forms.
A spike can appear in the following cases:
- There is a technical failure on the broker’s platform, after which traders see a long spike in the terminal.
- A large trading order has been executed.
- There is a price gap.
- Important economic new release.
- The seller has set an order at a lower price by mistake.
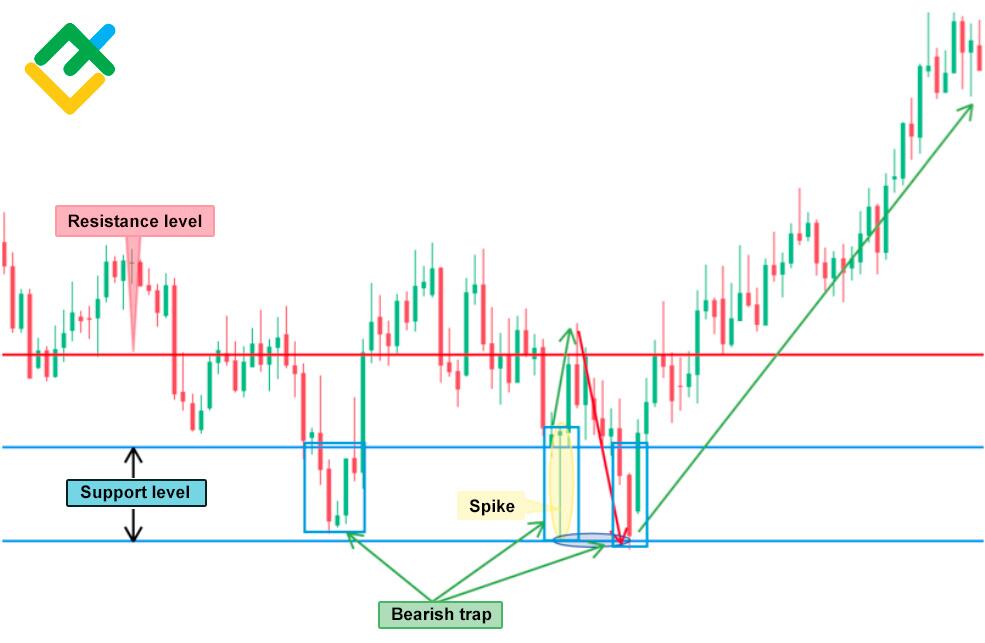
A spike pattern is illustrated in the USDCHF daily chart below.
You can see that bears try to break out the support level but bulls go ahead and return the lost positions on the same day.
Next, buyers try to break out the resistance level during three days but they fail. Bears go ahead and draw the price to the lower support level again.
At the support level, bulls again gain the control and turn the trend up.
Differently put, there is a bear trap; the stop losses are triggered and the uptrend gains momentum.
Bearish Engulfing Pattern
A bearish engulfing pattern is a combination of two candlesticks. The first candlestick is green or white, i.e. bullish. The second one is red or black, bearish, and its greater than the first one; so the second, bearish, candlestick engulfs the first one.
The bearish engulfing pattern should meet three conditions:
- A clear uptrend should be preceding the pattern.
- The body of the second candlestick should be red or black, and the shadow of the candle may not be engulfed.
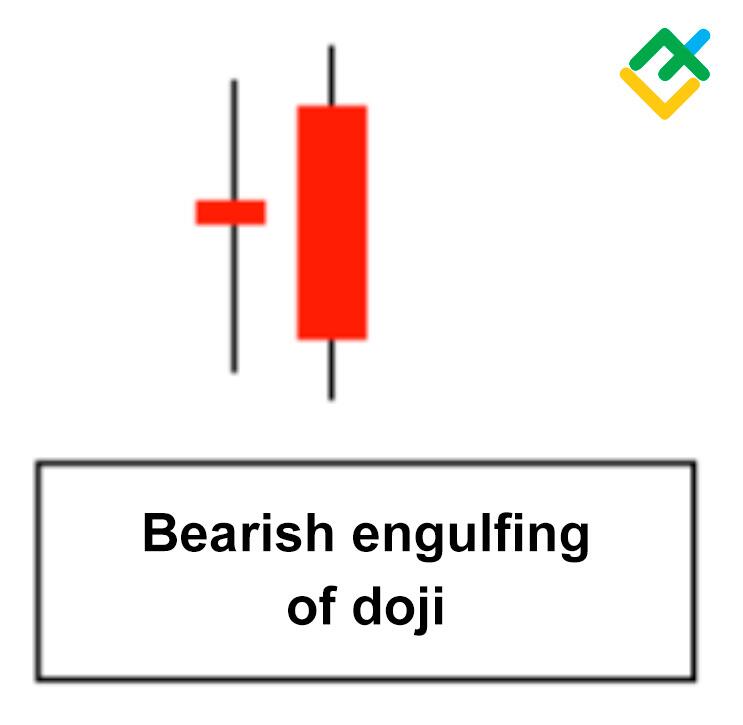
- The second candle should be bearish (black or red). An exception is possible if the body of the first candle is so small that it resembles a doji. In this case, in an uptrend, the engulfing of a small real body of the candlestick by a large red candlestick will mean a reversal.
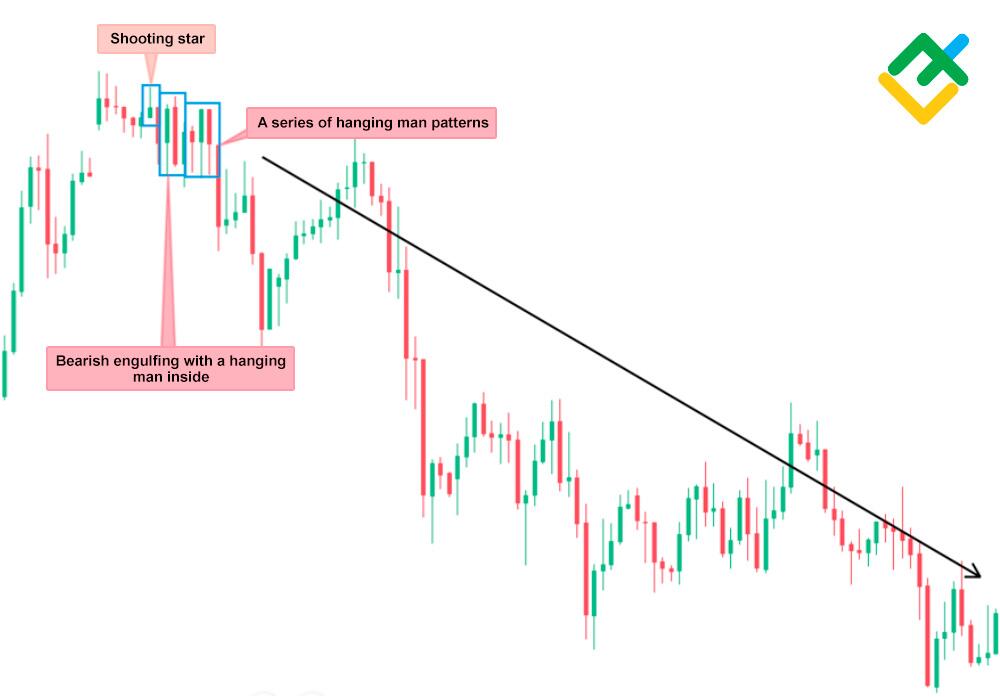
The UKBRENT hourly chart displays a bearish engulfing candlestick pattern. Let us explore the situation at the local high of the market trend.
The first reversal signal is a shooting star candlestick, suggesting a soon reversal. Next, there is a bearish engulfing pattern, with a hanging man reversal pattern inside.
Following these signals, the price declines significantly.
Bullish Engulfing Pattern
A bullish engulfing candlestick pattern, in contrast to bearish engulfing, is a combination of two candlesticks, where the second candlestick is green and it engulfs the first bearish candle.
A bullish engulfing candlestick pattern should meet three criteria:
- A clear downtrend should be preceding the pattern.
- The second candlestick’s body should be greater than the first one.
- The second candlestick should be green or white (bullish).
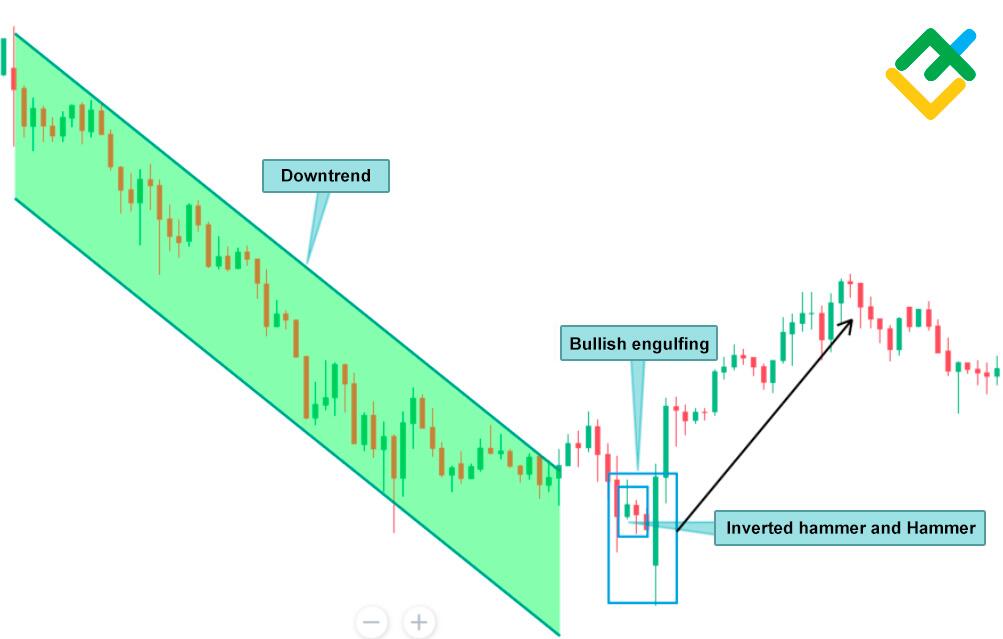
The XAUUSD hourly chart displays a bullish engulfing pattern following a downtrend.
You can see from the chart that the green candlestick engulfs he previous four-hour candlestick. The first reversal signal is two subsequent patterns, an inverted hammer and a hammer.
Bearish Harami
A bearish harami consists of a long bullish candlestick, followed by a small bearish candle.
Harami is similar to the Western Inside day technical analysis pattern. It looks like an inverse engulfing pattern.
A bearish harami signals a soon downside reversal of the trend.
You can see a bearish harami pattern in the 4H Tesla Inc chart, followed by the beginning of a downtrend. The pattern signals that the buying pressure weakens and a new downtrend should start.
Among other reversal patterns emerging at the high are a shooting star and a hanging man patterns.

Bullish Harami
A bullish harami pattern signals that the downtrend is exhausting and a new uptrend should soon star.
The H4 GBPCAD chart shows that the first signal of the downward trend exhaustion is a bullish harami. The upcoming reversal is confirmed by a series of the bullish reversal hammer patterns.
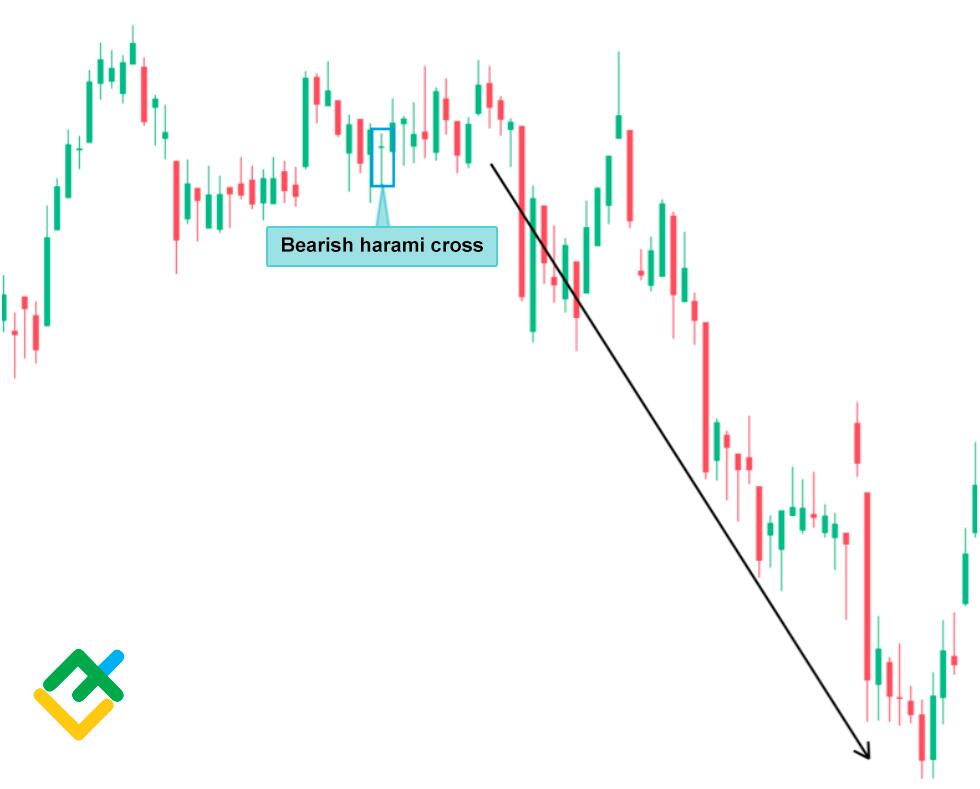
Bearish Harami Cross
A bearish harami cross is a strong reversal pattern that means market uncertainty. The pattern is a large up candlestick followed by a doji.
A bearish harami cross more accurately predicts the top of an uptrend than a bullish harami cross signal the bottom of a downtrend.
A harami cross pattern is similar to a doji star. The difference is that the harami cross forms within the range of the previous candlestick and has a small or no body.
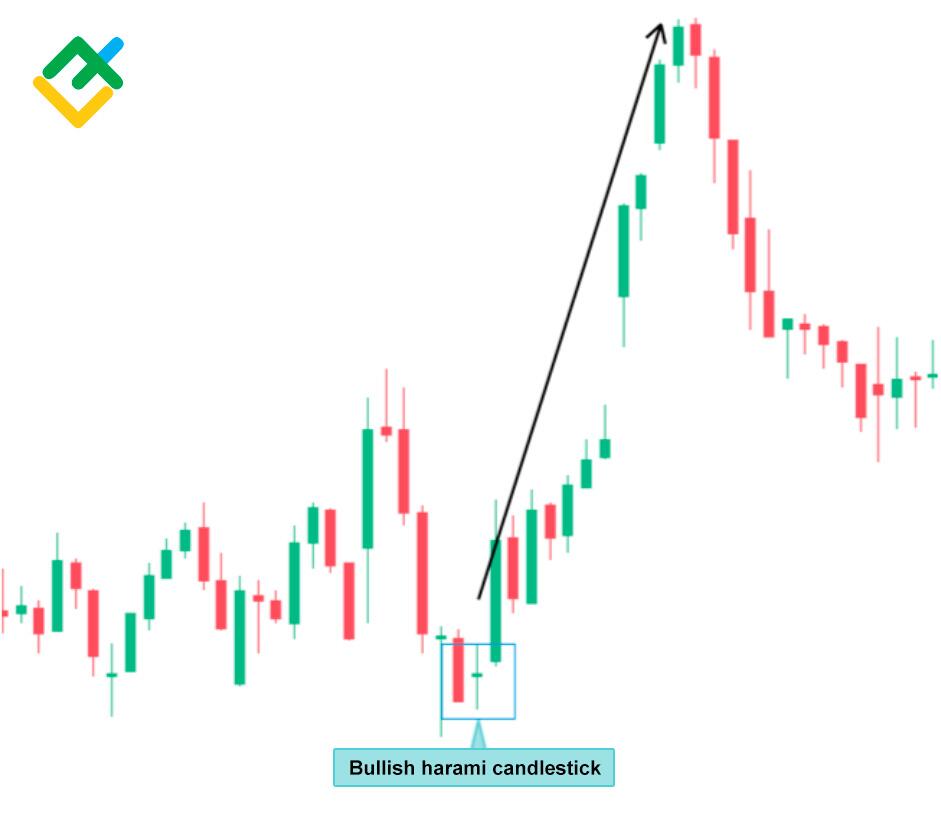
Bullish Harami Cross
A bullish harami is a candlestick with long shadows and a small or no body that forms within the range of the previous down candle (black or red).
The hourly Coca-Cola Co. CFD chart displays the bullish harami following a long red candlestick. This pattern signaled the start of the short-term uptrend.
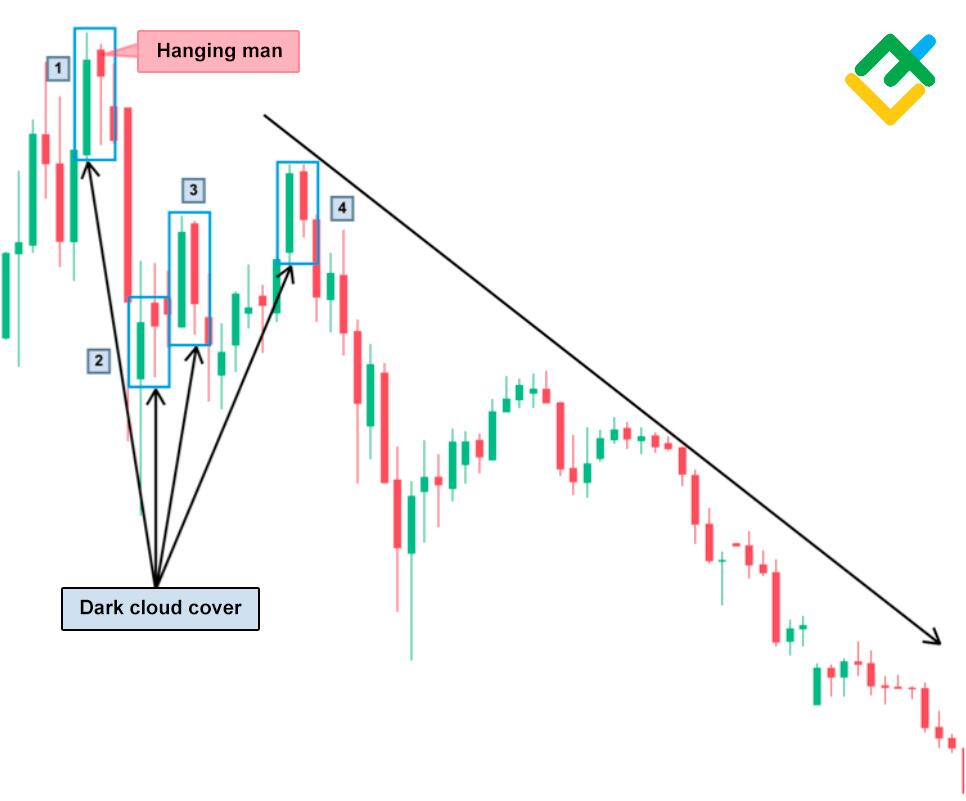
Dark Cloud Cover
The dark cloud cover pattern is a two-candle pattern that forms at the top of an uptrend or near the upper border of a sideways channel. The pattern is significant as it shows a shift in the momentum from the upside to the downside.
First, there forms a long bullish candle (green or white). The next candlestick opens above but then closes below the midpoint of the prior bullish candle. The longer is the bearish candlestick, the stronger is the trend reversal down.
The daily ETHUSD chart shows a hanging man within the dark could cover pattern. The combination of two reversal patterns at the trend’s high is a strong signal to enter short trades.
Besides, there are three more dark cloud cover patterns, confirming the downtrend.
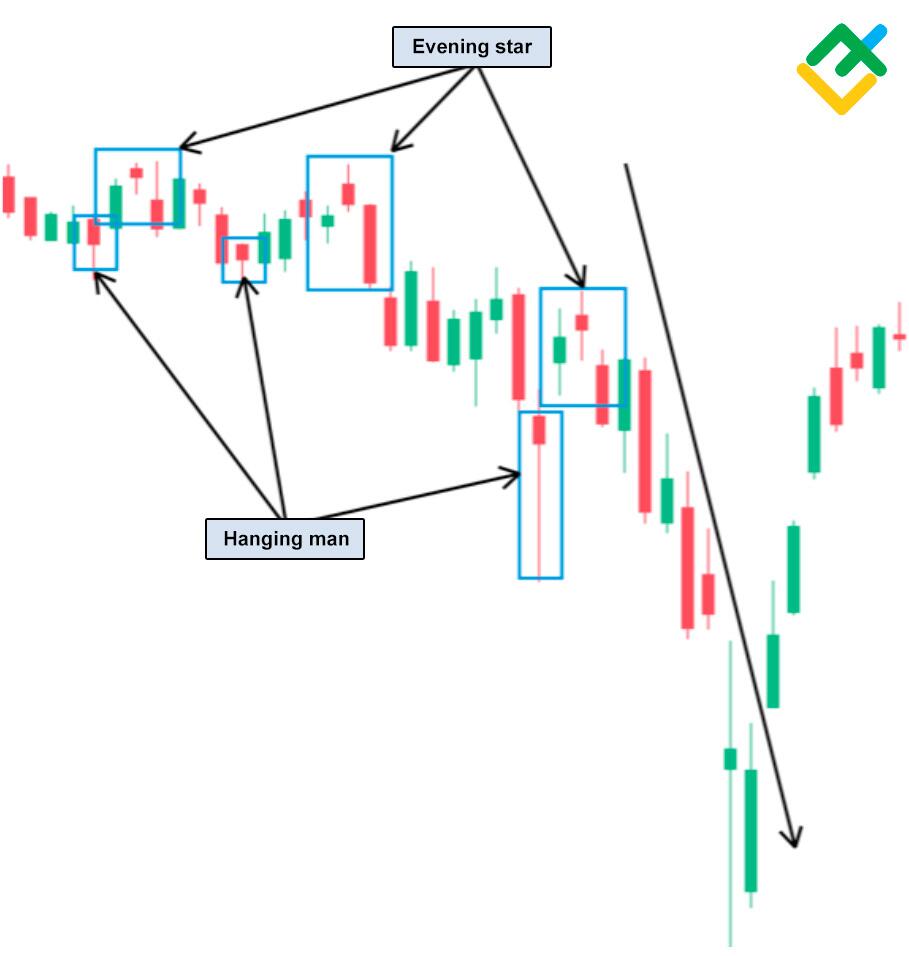
Bearish Evening Star
An evening star is a pattern composed of three candlesticks that signals a reversal at an uptrend’s high.
The first candlestick must be bullish, with a long body. The second candlestick should have a short body. The third candlestick should give the final signal of the bullish trend reversal down, it must be bearish and have a long body.
The pattern, like the morning star, should have gaps between the first and the second candlesticks, and between the second and the third candlestick. In practice, as a rule, there is one gap between the first and the second candlesticks.
It is important that the third, bearish, candlestick should be longer than the first, bullish one.
The 4H Walt Disney Co. stock chart displays a series of the evening star patterns, following which the price starts to decline. Further confirmation of a soon downtrend is a series of the hanging man patterns.
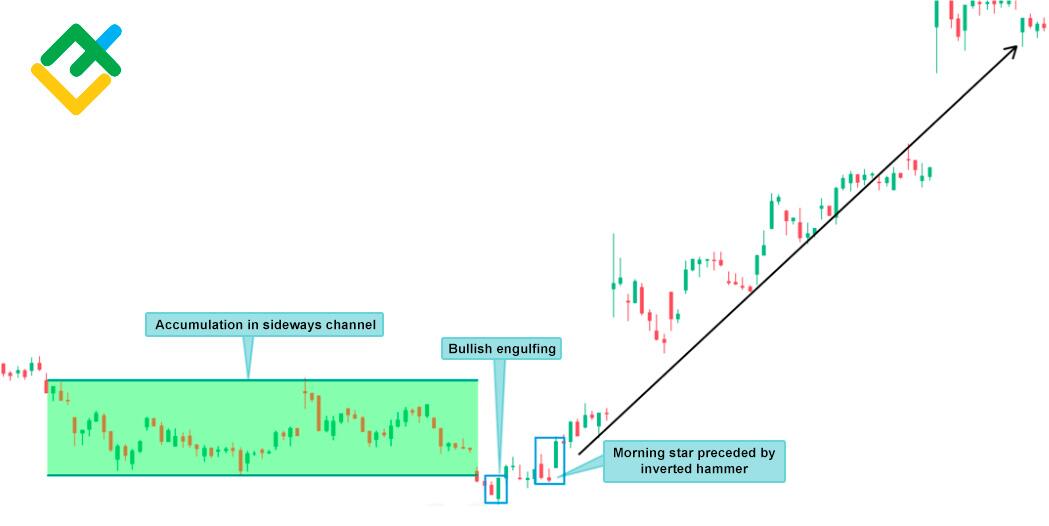
Morning star reversal pattern
A morning star pattern signals a soon trend reversal up, it usually appears at the low of a downtrend.
The below chart shows that the candlestick trading positions have been accumulating for a long time, and there appears the first buy signal, a bullish engulfing pattern, Next, a morning star pattern appears, with an inverted hammer inside.
These patterns are key signals of a soon uptrend.
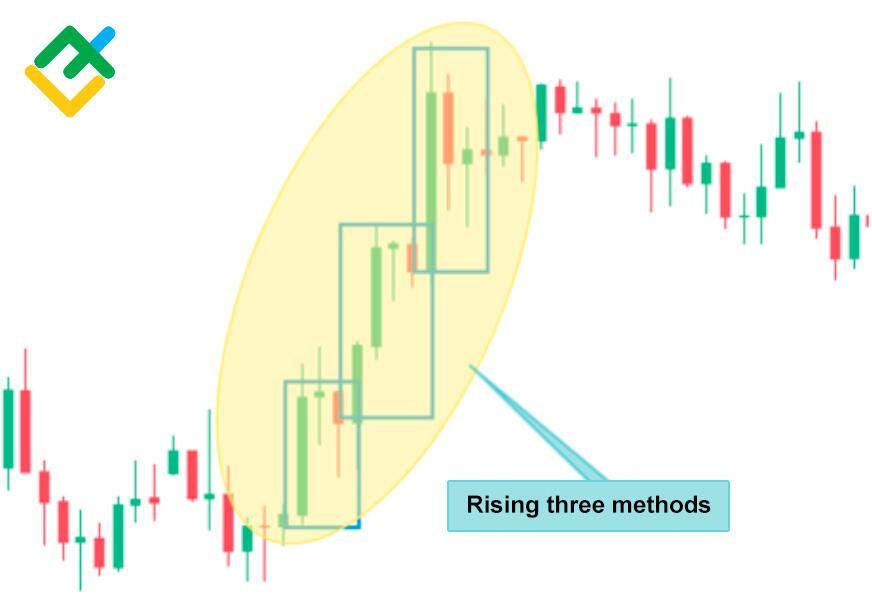
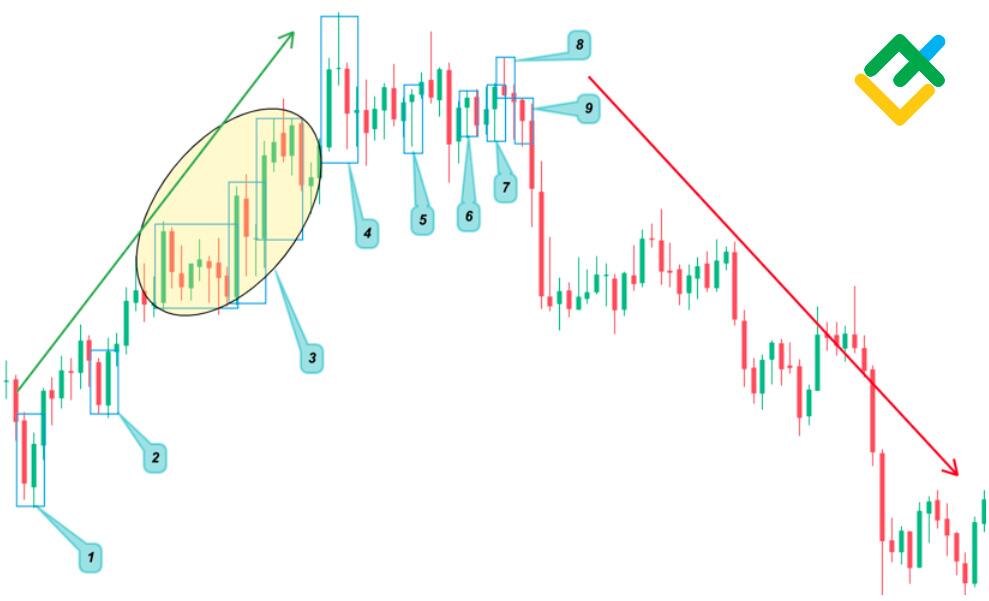
Bullish Rising Three
The bullish rising three is a bullish continuation pattern.
Another name for the pattern is rising three methods. The pattern looks like a bullish flag or a pennant.
The key feature of the pattern is a long bullish candle, followed by a short-term sideways trend, after which the uptrend resumes.
The pattern is composed of:
- Long bullish candlestick;
- A few falling candlesticks.
In an ideal situation, there should be three candles; but in practice, there could be two or four candlesticks.
There is a bullish candle with a long white body. The movement should start above the lower border of the previous candle and impulsively break through the closing price of the first bullish candle.
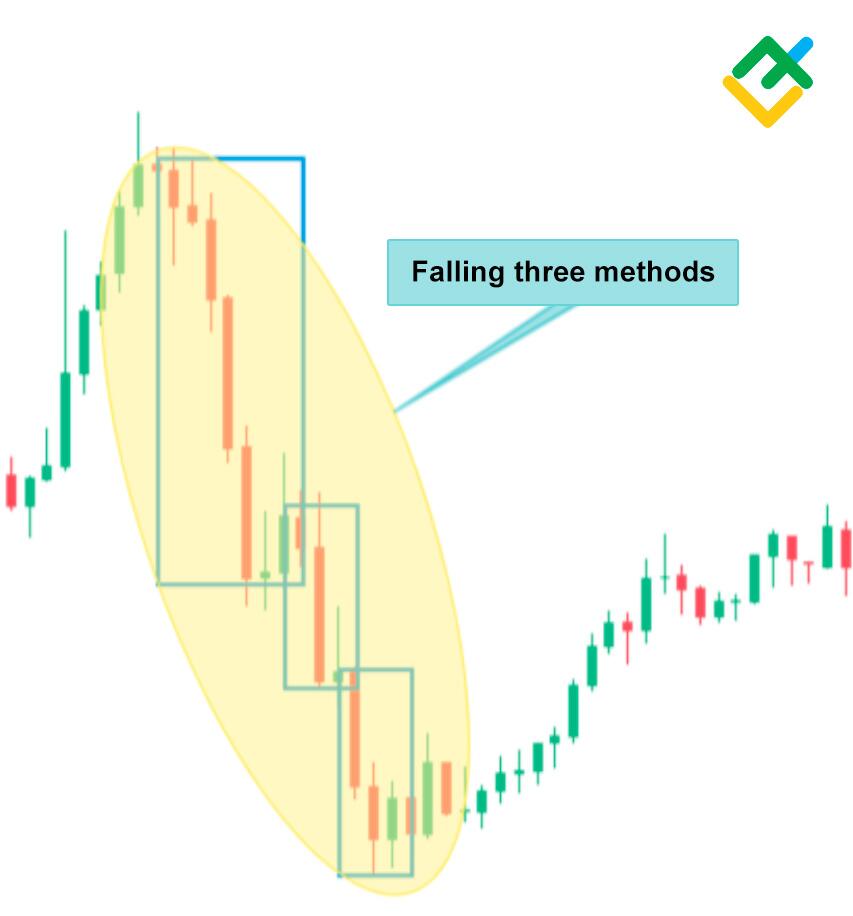
Bearish Falling Three
Bearish falling three or Falling three methods is opposite to the bullish rising three.
The pattern appears in a downtrend and signals the bearish trend continuation.
Candlestick patterns chart analysis
It is not as difficult to analyze the candlestick chart as it may seem.
A beginner chartist should be able to recognize common trend reversal and continuation patterns, as they appear most commonly in the chart.
Let us study an example of technical analysis of the daily XAGUSD chart.
- At the trend’s low, there appears a cloud break pattern, followed by the price growth.
- A Bullish engulfing pattern signals a soon price growth.
- A Rising three methods pattern encourages the bulls to go ahead.
- However, following the price rally, an evening doji star appears, signaling a downward reversal.
- A hanging man at the high signals the trend reversal down.
- Another hanging man pattern appears.
- A hanging man.
- A shooting star pattern signals that selling pressure is rising.
- A classical hanging man pattern, which is followed by a sharp price drop.
Thus, at this chart section, one could make profits by both going long and short:
- One could enter a long-term purchase at a level around the cloud break pattern or the bullish engulfing. The position could be exited following the second reversal signals, i.e., after the evening doji star.
- One could enter a long-term short trade at the level around the evening doji star, shooting star and a series of hanging man patterns. A combination of these patterns signals growing selling pressure, suggesting a soon downtrend.
As you see from the example, classical trend reversal and condition patterns appear most commonly in the price chart.
Example of candlestick patterns trading in Forex
In this section, I will demonstrate an example of candlestick patterns in Forex trading with the trade volume of 0.01 lot.
Let us look at the hourly Forex charts of USCRUDE oil. The trend turns up above the local support level 115.327 as there appears a Bullish belt hold pattern. Another name for the pattern is a bullish candle. This pattern signals the price growth from this level, and it is relevant to enter a buy trade. In the example, I enter a buy trade at level 116.969, setting a stop-loss at 115.320 and a take-profit at 119.704.
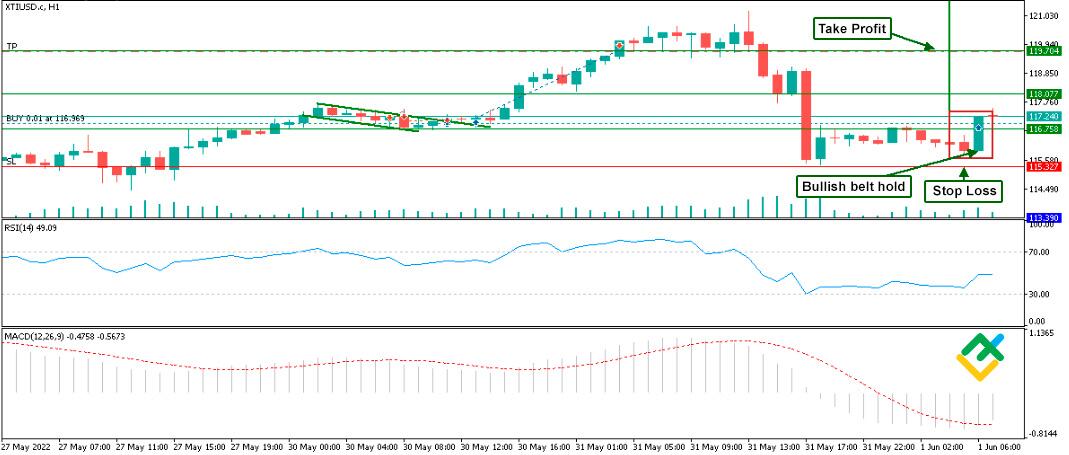
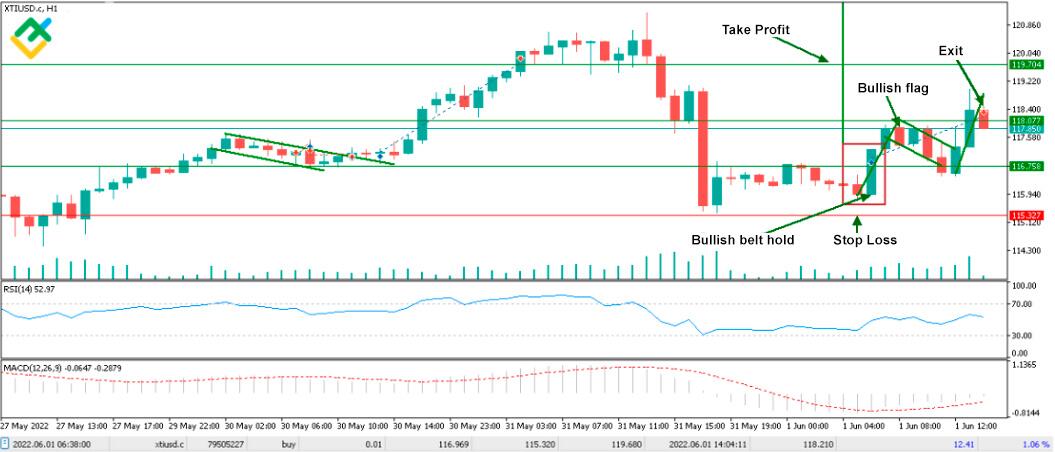
The trade is exited with a profit of $12.41 in eight hours. Following the bullish candlestick, there is forming a bullish flag. After a short correction down to the buy level, the price breaks out the flag but doesn’t reach the take profit. The trade was exited because of strong selling pressure, as is clear form the last candlestick.
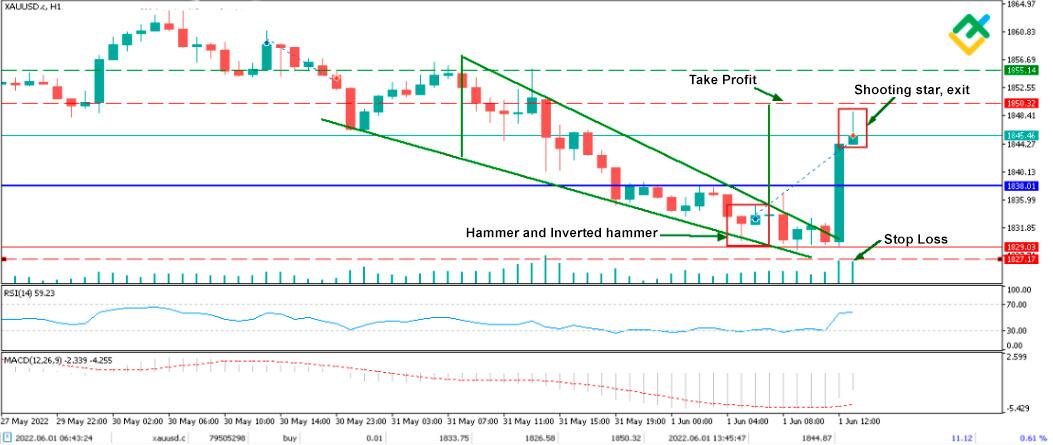
On the same day, there is a good trading session in the gold price chart.
The XAUUSD hourly chart displays a falling wedge. There are two bullish reversal patterns at its bottom, an inverted hammer and a hammer candlestick pattern. Based on the signal, I enter a buy trade, with a stop loss at the level, a little lower than the lower shadow of the hammer pattern, level 1826.58.
A take profit is set at level 1850.32.
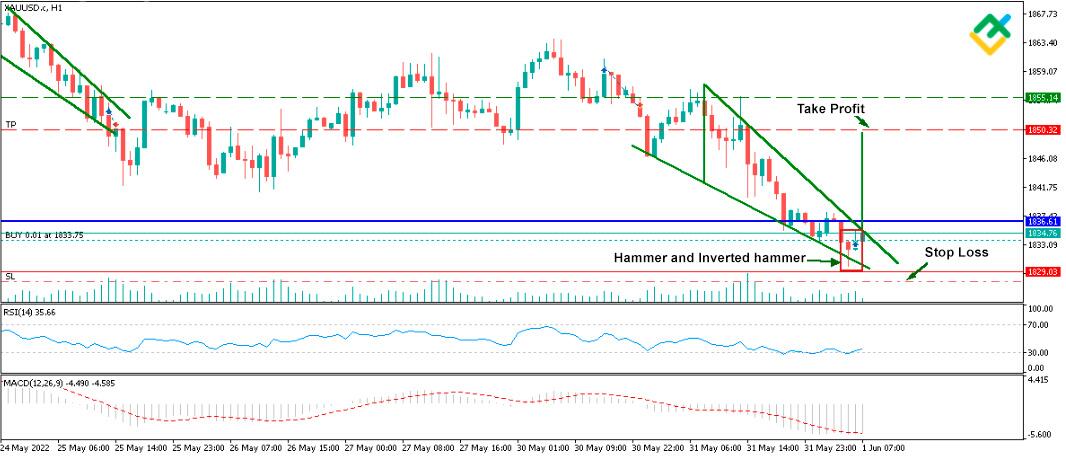
After five hours of trading in the range, the bullish momentum breaks through the upper border of the falling wedge.
The trade is exited below the take profit, as there is a strong resistance level, confirmed by a shooting star pattern.
The trade yields a profit of 11.12 USD.
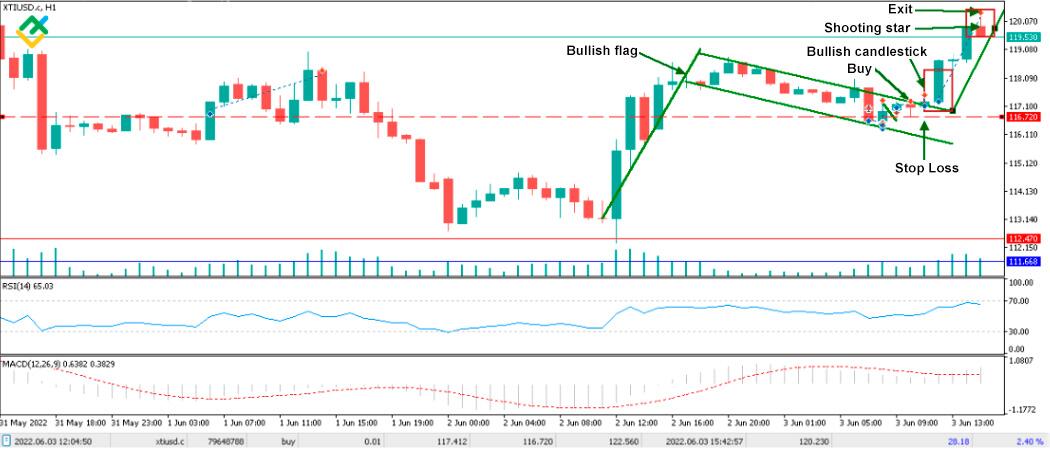
Let us have a look at the hourly oil price chart.
You can see from the chart below, there is forming a bullish flag. Following a descending consolidation, bulls break out the resistance, and the price draws a bullish candlestick pattern.
A good entry level is 117.412. A stop loss is set in the middle of the flag, level 116.720.
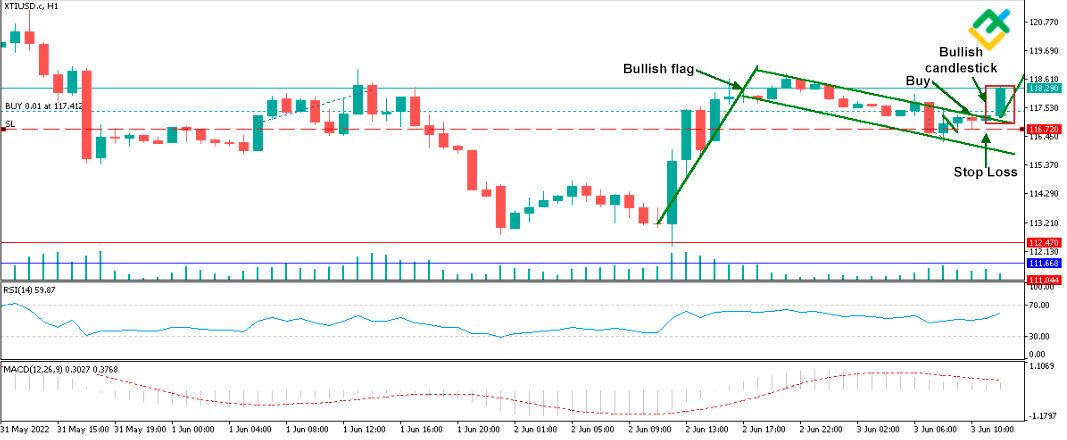
The trade yields a profit of 28.18 in four hours. The exit signal is a shooting star pattern. The red candlestick means strong selling pressure, warning the bulls.
Conclusion
Trading Forex market with candlestick patterns may seem complicated, but having learnt major patterns and practicing trading, you will learn to trade successfully.
To start trading in different markets, it will be enough to study the major reversal and trend continuation patterns that will allow you to make profits from trend reversal.
This article covered the following topics:
- What the candlestick chart is and how to analyze it;
- How to trade successfully using candlestick patterns;
- Benefits of the Japanese candlestick chart over the bar chart;
- Types of candlestick patterns.
I also gave examples of candlestick analysis in the real price charts, described how to define candlestick patterns and trade them in real trading.
The Japanese candlestick charts offer traders an opportunity to monitor the price movements and predict the changes in the trend.