To create a real forex account for free, click here
This article deals with the price chart pattern concept and explains the most profitable chart patterns. I will describe the most popular Forex candlestick chart patterns, explain how to discover the candlestick formations in the chart and trade them.
You will learn how to trade Forex price chart patterns. I will also share my experience and my own original Forex candlestick chart patterns, which I’ve been using for many years.
I hope you will appreciate the hard work I have put into creating this material! It will help you improve your Forex trading skills and your trading performance!
The article covers the following subjects:
- What are patterns in Forex?
- Types of patterns
- 3 most common and effective candlestick patterns
- Triangle chart pattern
- Double Top chart pattern
- Double Bottom chart pattern
- Triple Top chart pattern
- Triple Bottom chart pattern
- Head and Shoulders chart pattern
- Inverse Head and Shoulders chart pattern
- Wedge chart pattern
- Flag chart pattern
- Pennant chart pattern
- Broadening Formation pattern (megaphone pattern)
- Diamond chart pattern
- Spike pattern
- Volume candlestick pattern
- Tower chart pattern
- Three Crows pattern (Three Buddhas)
- Cube pattern (Golden Cube)
- Tweezers pattern
- Gap pattern (Gapping play)
- Mount pattern
- Symmetrical Channel pattern
- Three Stair Steps pattern
- Flat Breakout pattern
- Patterns for Cryptocurrency trading
- Conclusion
- FAQs about Forex chart patterns
What are patterns in Forex?
The analysis of price action movements started when the asset’s price chart appeared. First Forex charts were drawn on the graph paper, and that is when the first analysts noticed that there were some zones in the chart where the price made similar swings in different periods of time. Those were the first Forex chart patterns. Forex traders called them price chart patterns because the first patterns looked similar to geometric objects, like a triangle, a square, a diamond. When it became available to see the chart on a computer screen and analyze longer periods of time, new chart patterns started to appear. Currently, there are over 1000 price formations that are studied by graphic analysis, a branch of technical analysis.
Of course, many of them are just their authors’ imagination, but, on the other hand, that is the way, how the first and the most popular chart patterns appeared. Later, technical analysis was expanded, and the Forex chart patterns were enriched by candlestick chart patterns. In the following parts, I’ll dwell upon the most common Forex Japanese candlestick patterns and some original configurations.
Forex traders use candlestick chart patterns to identify Forex trading signals – or signs of future price movements, in order to enter a trade at the right place. As I’ve already noted, the first pattern to analyze trading Forex charts, included into technical analysis, is thought to be the Triangle chart pattern (such as ascending triangles, descending triangles or symmetrical triangle). So, I’ll start with it.
Types of patterns
All chart patterns can be roughly divided into three big groups, based on the way the asset’s price is moving. There are three major types of chart patterns.
Continuation chart patterns
An extension chart pattern appears when the asset’s price is already trending in a certain direction. If you have discovered a continuation pattern, it means that the price is likely to move in the same direction. The most common continuation chart patterns are: rising wedges, rectangles, and pennants.
Reversal chart patterns
They usually appear when the ongoing trend is exhausting. If you have identified a reversal chart pattern, and the price is trending, the price is likely to reverse after a clear paradigm emerges. The reversal patterns suggest that the current trend line is going to end. They include double and triple bottom, double and triple top, head and shoulders patterns, inverse wedges, and ascending and descending triangles.
Bilateral chart patterns
They suggest a new momentum, but its direction is likely to be the same. Such models can emerge during trading flat or trading in the same direction. How can you handle pattern that is bilateral? These signs are quite important for a bilateral chart pattern, as you can enter a new trade at the breakout at the right time.
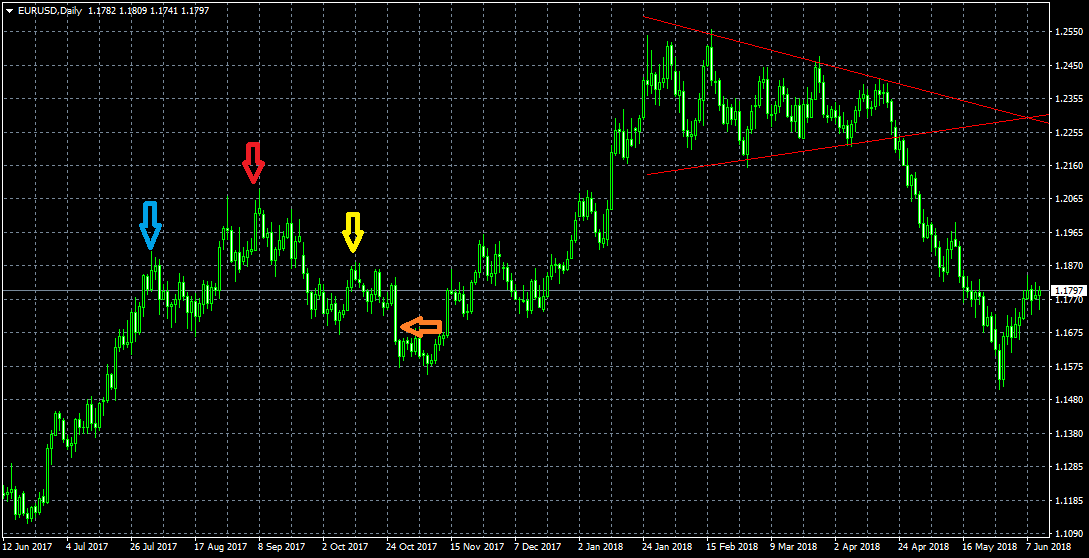
A head and shoulders chart pattern is marked with arrows in the EURUSD daily chart. The blue arrow points to the left shoulder, the yellow one – to the right shoulder, the red arrow points to the head. The orange arrow marks the drop as long as the neck. Red lines mark the wedge chart pattern, followed by the price decline.
3 most common and effective candlestick patterns
When technical analysis appeared, people noticed the zones in the price charts where the price moves repeated after a while. They started to highlight these zones and mark them. Next, when Forex traders saw the zone in the Forex chart that was noticed earlier, they could assume how the price would move after such a zone, where the price declines or rises. That is how first price action patterns appeared, or what we now call Forex chart patterns or formations.
They were first called so because they looked like geometrical patterns, a triangle, a cube, a diamond. Over time, there were defined clear rules for each pattern, and that is how graphical analysis appeared. Common chart patterns are used for forecasting in Forex like they were used earlier, along with support and resistance levels. In my onion, patterns are the most accurate tool of graphical analysis. You only need to discover price patterns in the chart, and, if it works out, enter a trade and enjoy your profit. Next, we will deal with the three most common Forex chart patterns that will never lose their relevance and will suit both beginners and advanced traders.
Well, let’s take a closer look at the three best price chart patterns.
Third place: Head and Shoulders chart trading chart pattern (S-H-S)
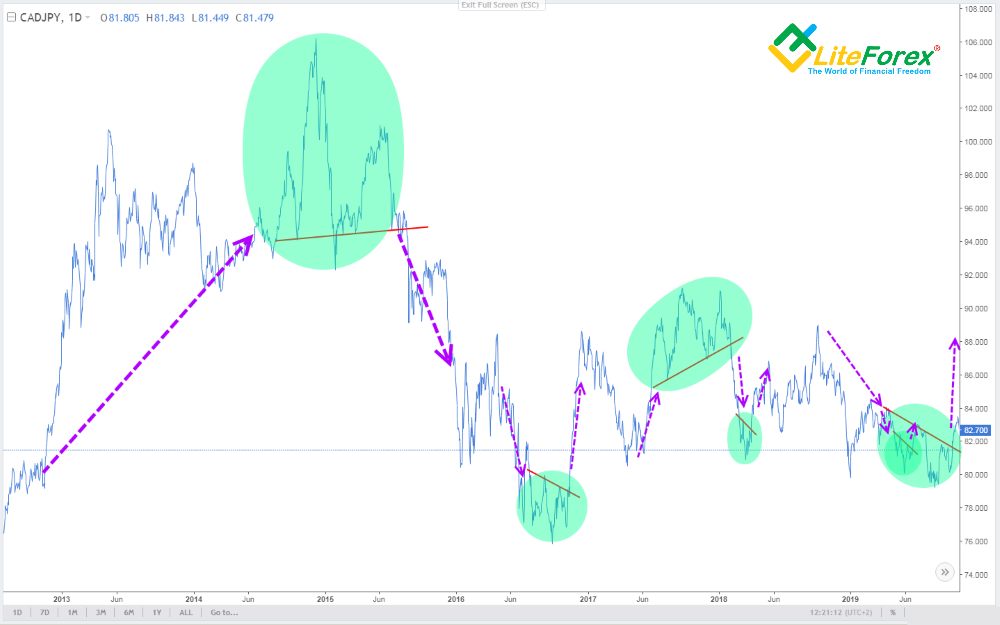
Head and shoulders is a very popular reversal Forex chart pattern. The chart pattern is more discernible in a linear chart, but you’d better enter trades based on the candlestick chart (Japanese candlesticks are in the online terminal).
There is the AUDNZD price Forex chart above. There are two modifications of the pattern. The first is a direct Head and Shoulders pattern where the head is the head and shoulders top (red), it looks like a double top formation. There is also can be an inverse Head and Shoulders chart pattern (green) that looks like a double bottom pattern, both are reversal chart patterns.
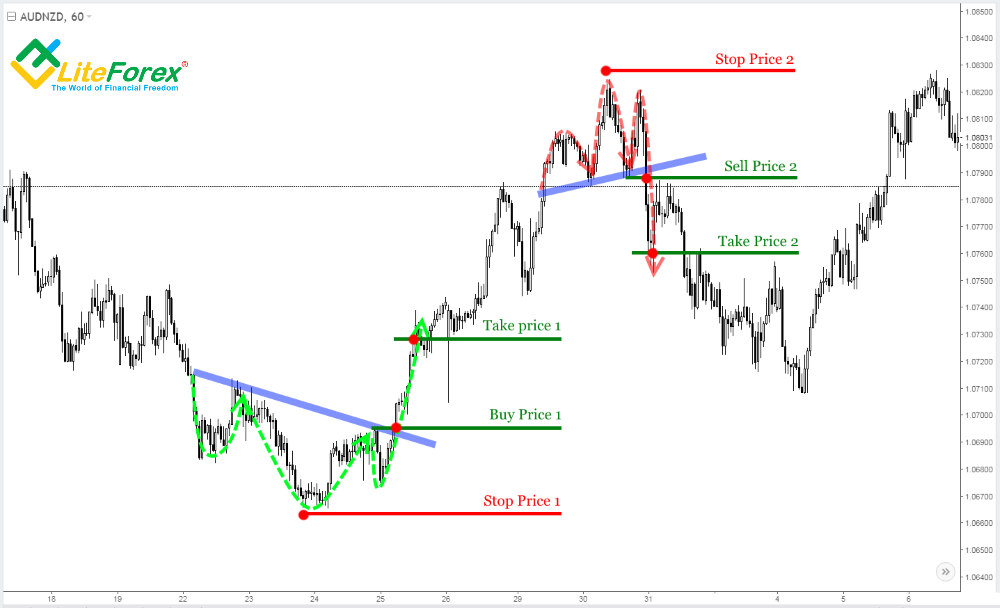
Let’s see how you open a buy position according to the signal delivered by inverse head and shoulders patterns (green):
- Find three consecutive extremes of the head and shoulders, in this case, lows, the middle one should be lower than the other two (higher, if the pattern is direct);
- Next, we draw a simple trend line along with the highs, this will be the neckline (purple);
- Now, we have a classical resistance line, the buy signal appears when the price breaks this line upside.
- Now, the most important! Make sure that there was a clear downtrend ongoing before the first low of the head and shoulders pattern has been formed. And this trend line should be at least twice as long as the depth of the middle low of our pattern. If there isn’t such a trend, the patterns will be not valid, and you can’t open positions according to it. In our example, there is such an ongoing trend and the pattern is valid;
- Trading with almost any pattern, you open a position using a pending order, not by the financial markets order, and so, we put bending orders;
- A buy limit is put at the level of the next price high after it breaks through the pattern neckline (Buy Price 1);
- A take profit for our buy limit is set as follows: measure the distance between the lowest point of the middle low of the pattern (Head) and the neckline in points using the Ruler tool. Put this distance up from the price of the buy limit. Next, subtract about 15%-20% from this distance and put a take profit (Take Price 1);
- A stop loss is set at the level of the low of the entire formation +15%-20% (Stop Price 1).
Second place: Broadening formation trading chart pattern
This pattern is easier spotted in the linear chart, as the candlestick chart often distorts high and lows.
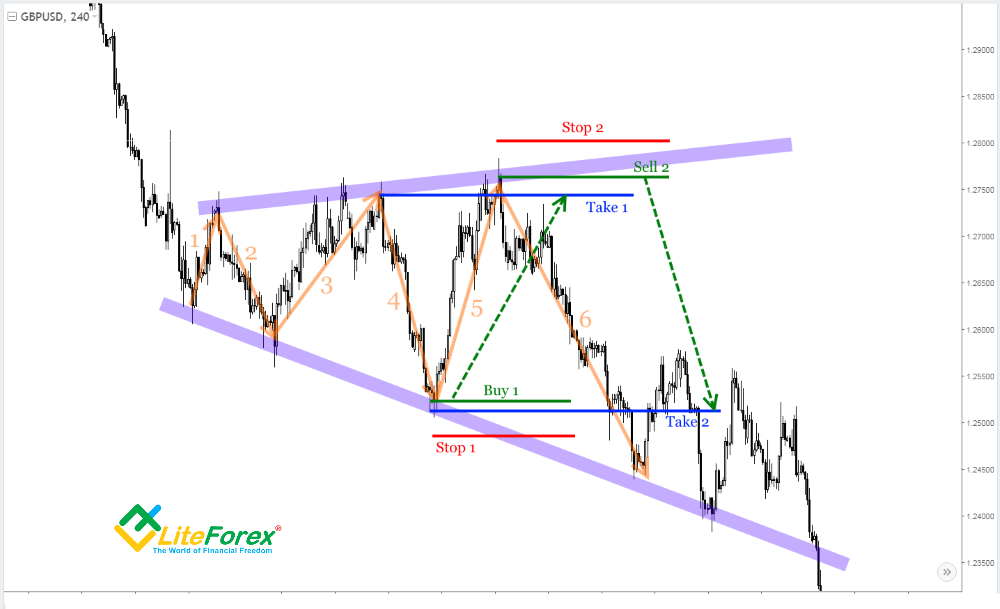
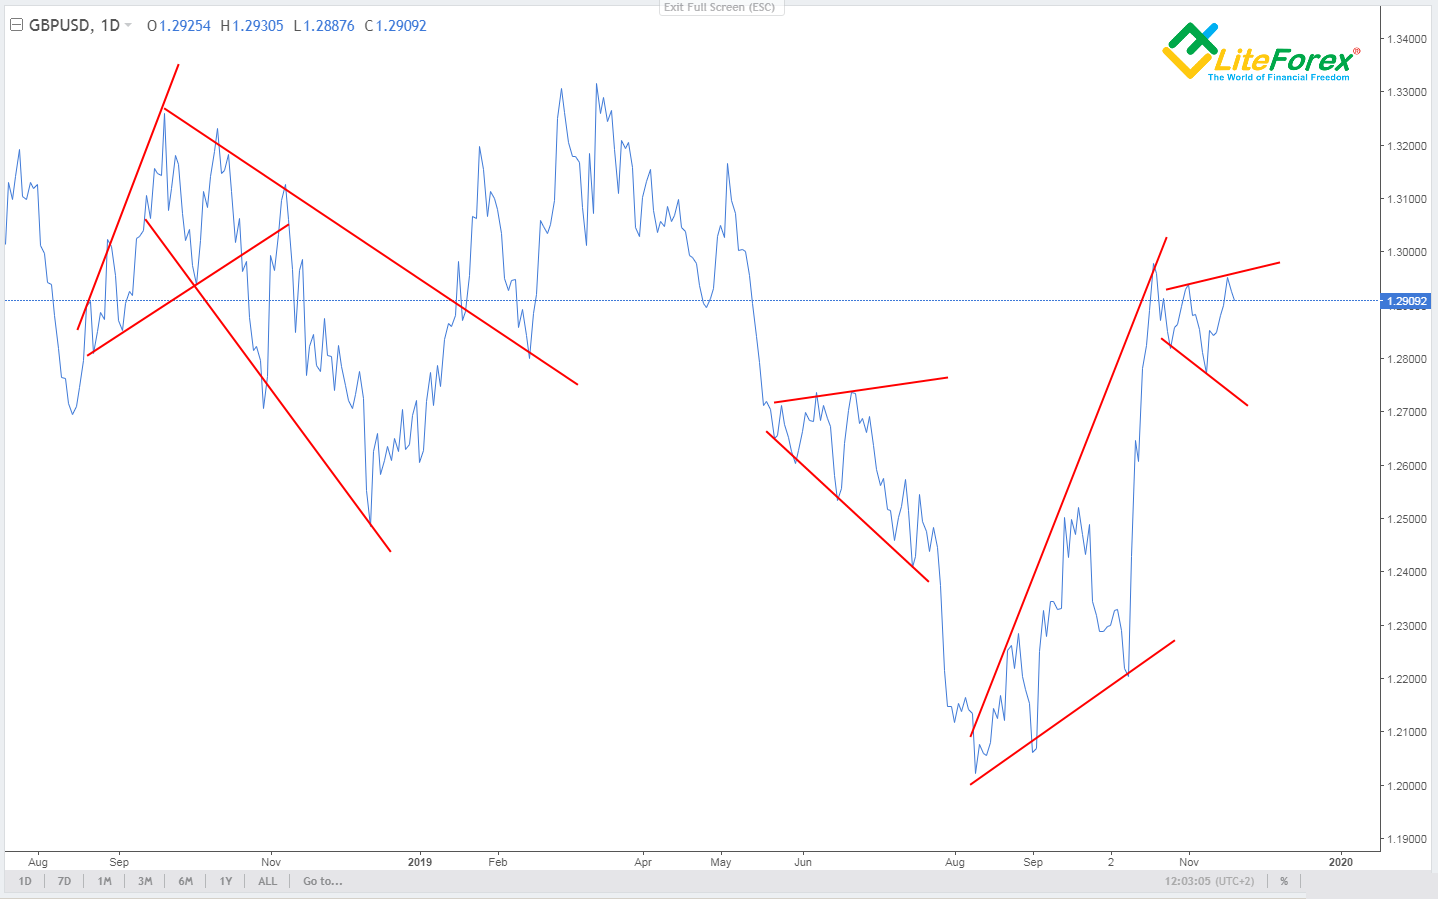
There is the GBPUSD raw price action chart above that displays a broadening formation pattern that looks like an inverse triangle.
Let’s see how you open positions to buy and sell according to the signal delivered by a broadening formation pattern.
- First, find a price pattern that looks like the formation depicted in the Forex chart.
- Define lows and highs: there should be at least 4 (2 highs and 2 lows);
- The asset’s price movement from the high to low and vice versa within the pattern is referred to as a pattern’s wave. We need to define the number of waves;
- You can start to trade the pattern only if wave 4 completes within the pattern;
- According to the statistics, there are often six or more waves in the pattern. So, we shall trade waves 5 and 6;
- In the given example, we shall buy according to wave 5 trading signal and sell according to wave 6.
- We enter a buy trade only when reversal patterns are clear following wave 4 (Buy 1).
- A take profit is set at the level where wave 4 started (Take 1);
- A stop loss is set below the support line of the pattern (Stop 1)
- We open a sell trade according to wave 6 when there are indications of reversal patterns following wave 5 (Sell 2).
- A take profit is out at the level where wave 5 started (Take 2);
- A stop loss is set above the pattern’s resistance levels (Stop 2);
- It has a significant risk to enter trades based on the following waves, as the formation most often finishes with wave 6 that can lead on losing money rapidly.
First place: Volume Candlestick pattern
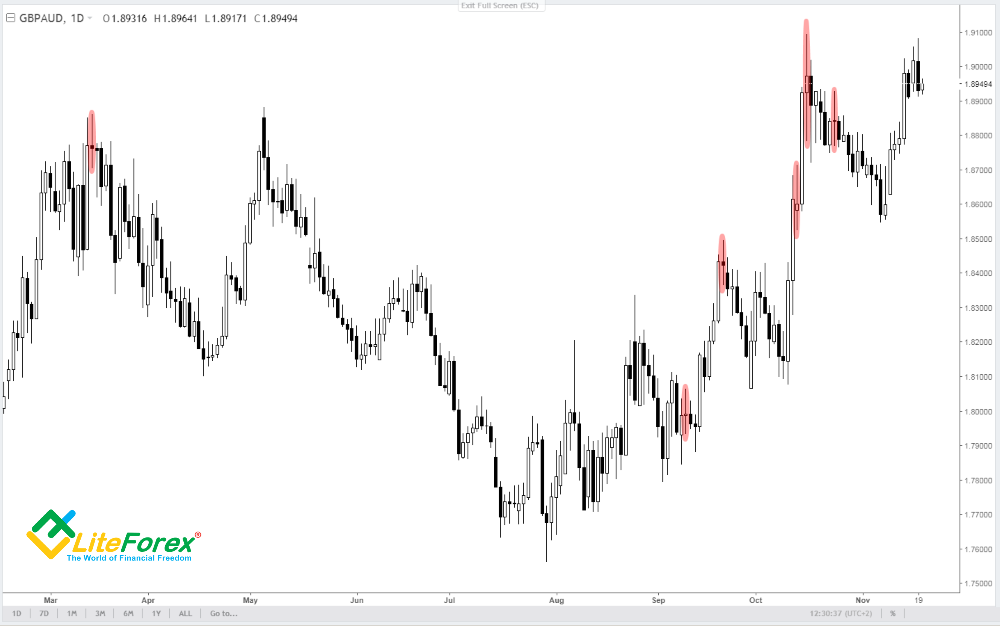
This pattern consists of just a single candle. It is often spotted in the D1 and H4 Forex charts.
There is the GBPUSD currency pair Forex chart that represents quite a seldom formation that is, in my opinion, is one of the most efficient raw price action patterns of technical indicator analysis.
The pattern looks like a candle with a very small body and very long tails (wicks). The candlestick is called volume candle because it emerges when there are large trade volumes in the opposite directions in the financial markets (the uptrend of bulls and the downward trend of bears). Therefore, by the time of candlestick closing, the market hasn’t yet determined the new ongoing trend, as the demand and the supply are almost equal. However, the balance can’t last for a long time, and either buyers or sellers finally win, driving the price in the corresponding direction. The price should soon break through the low or the high of the volume candlestick, sending us a signal to enter a trade and work out the pattern.
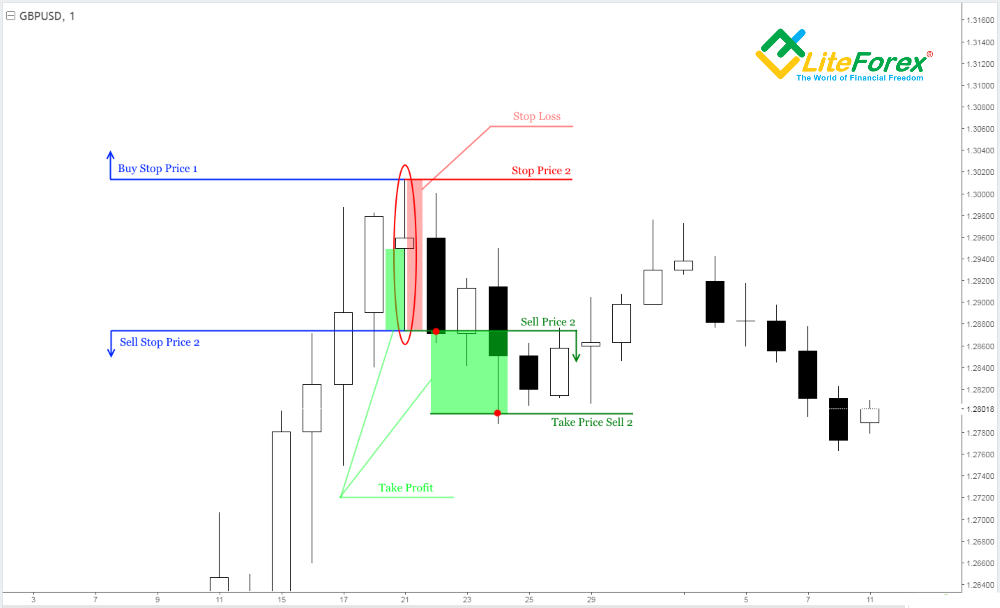
Well, let’s see how you open positions to buy and sell according to the signal delivered by a volume candlestick pattern.
- You should look for a volume candlestick pattern only in the two timeframes, they are the daily and the four-hour charts (D1 and H4).
- Each shadow without the candlestick body should be at least 400 pips.
- The candlestick body shouldn’t be longer than 1/10 of the entire formation.
- The color of the candlestick body doesn’t matter. An ideal volume candlestick is a doji
- If the current Forex markets price hasn’t broken through the low and the high of the volume candlestick, the pattern is valid.
- You put a buy stop and a sell stop at the candlestick high and low respectively (Buy Stop Price 1 and Sell Stop Price 2).
- The price target profit is put at the distance shorter than or equal to the length of the corresponding shadow.
- A reasonable stop loss is set at the level of the opposite extreme, low/high (Stop Price 2).
- When the price hits the level of one of the pending orders, the position will be opened (Sell Price 2).
- The position will close automatically.
- When one of the orders works out, the opposite should be manually canceled.
Train on the demo account and start making money on the real one. Everything is quite simple! I wish you successful and profitable trades with the most common Forex market chart patterns!
Triangle chart pattern
Currently, there are many different kinds of symmetrical triangles (e.g. ascending triangles, descending triangles, etc.); however, they are all based on the same principle. In the common technical indicators analysis Triangle is in the group of continuation common chart patterns. Such a continuation pattern signals that the trend, ongoing before the triangle appeared, can resume after the pattern is complete.
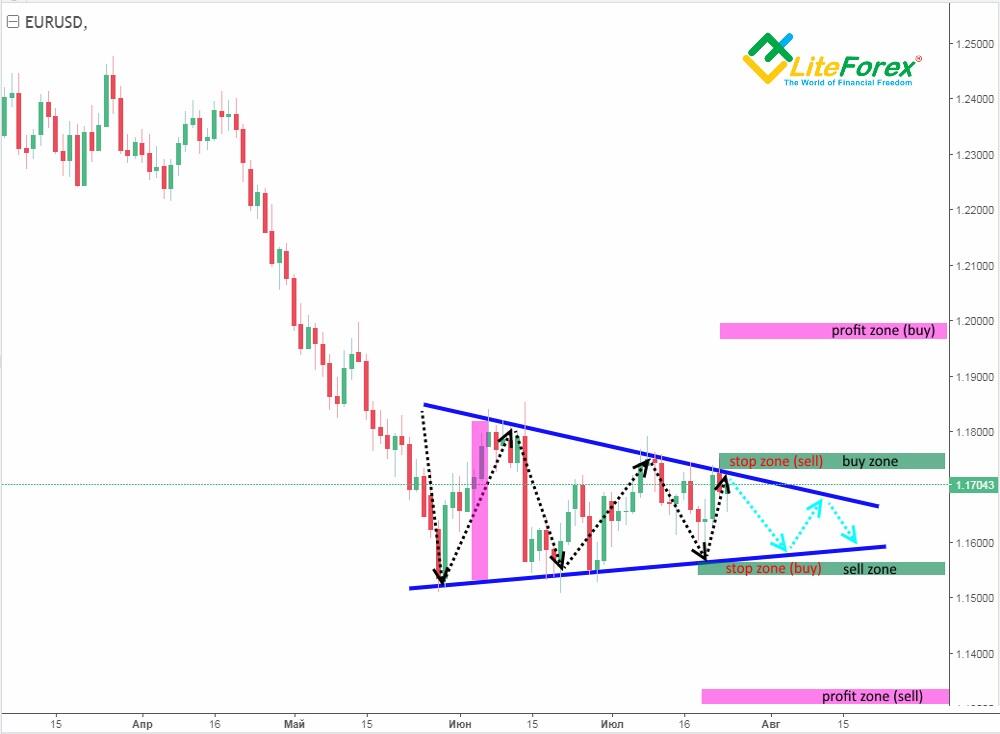
In the picture above, you can see one of the common symmetrical triangles that hasn’t yet been complete at the moment.
In technical terms, a triangle is a narrowing sideways channel that usually emerges at the end of the trend. The triangle basically works out when the range of the price swings is extremely low, there emerges a momentum and the price, breaking through one of the figure’s legs, goes further in the breakout direction. I suggest analyzing the scenarios of both upside and downside breakout on the given example.
So, in classical technical patterns analysis, a Triangle chart patterns signal that the price can move either way; fortunately, you don’t have to guess, as when the common chart patterns develops, there are clear rules of identifying entry points.
If you trade a triangle pattern, it makes some sense to enter a buy trade when the price, having broken through the pattern’s resistance levels, reached and exceeded the local highs, marked before the resistance line breakout (buy zone).
The profit target should be taken when the price covers the distance less than or equal to the breadth of the first pattern wave (profit zone buy). A stop loss in this case might be placed at the level of the local low, marked before the resistance level breakout (stop zone buy).
A sell position can be opened when the price, having broken through the pattern’s support line, reached or pressed through the level of the local low, preceding the support level breakout (sell zone). The target profit should be fixed when the price has covered the distance equal to or less than the breadth of the first wave (profit zone sell). A stop loss, in this case, should be placed at the level of the local high, preceding the support line (stop zone sell).
What can be added? Statistically, 6 out of 10 triangles are broken out in the same direction of the flag pattern. Therefore, when trading in the Forex market, you should be more careful about the traders, directed against the trend.
The ascending or descending Triangle pattern is very important in the Elliott wave analysis. The Triangle pattern is thought to be one of the corrective waves of the directed cycle, it is the further evidence that the ongoing trend is more likely to resume after the asceding or descending triangle pattern is completed.
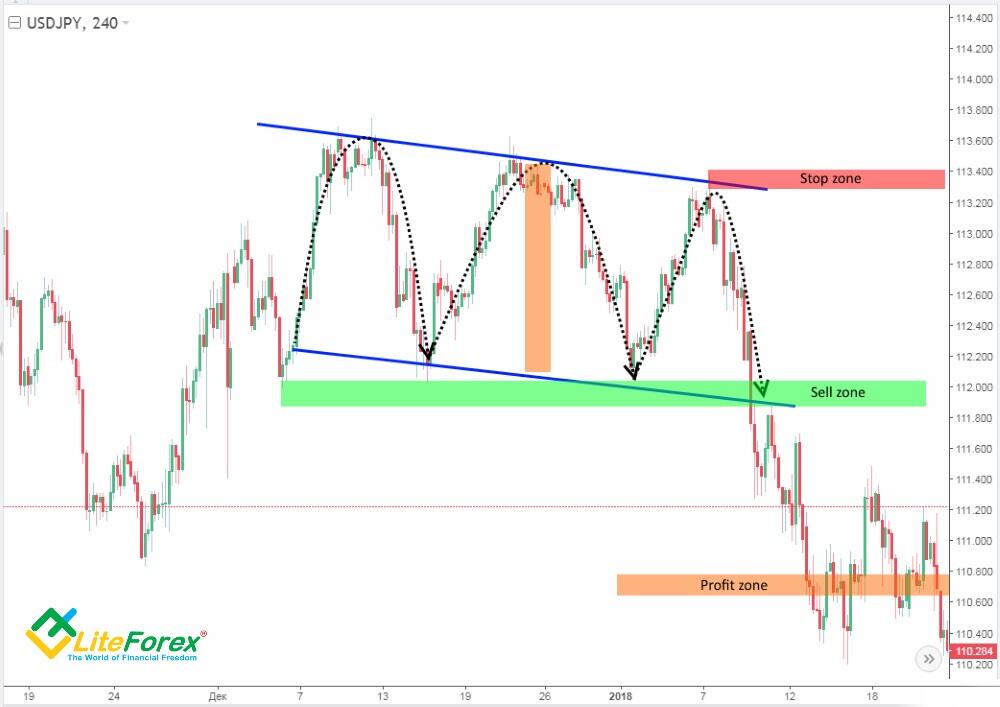
Double Top chart pattern
This pattern is classified as one of the simplest ones, so, it is usually less efficient than the other chart patterns. In classical technical indicators analysis, a Double Top formation is classified as a reversal chart pattern. That is the trend, ongoing before the formation starts emerging, is about to reverse after the pattern is complete.
The pattern represents two consecutive highs, whose peaks are roughly at the same level. The pattern can be both straight and sloped; in the latter case, you should carefully examine the tops’ bases that must be parallel to the highs.
In the classical analysis, a Double Top works out only if the trend reverses and the price heads down; if the price hits the third high, the formation transforms into the Triple Top pattern.
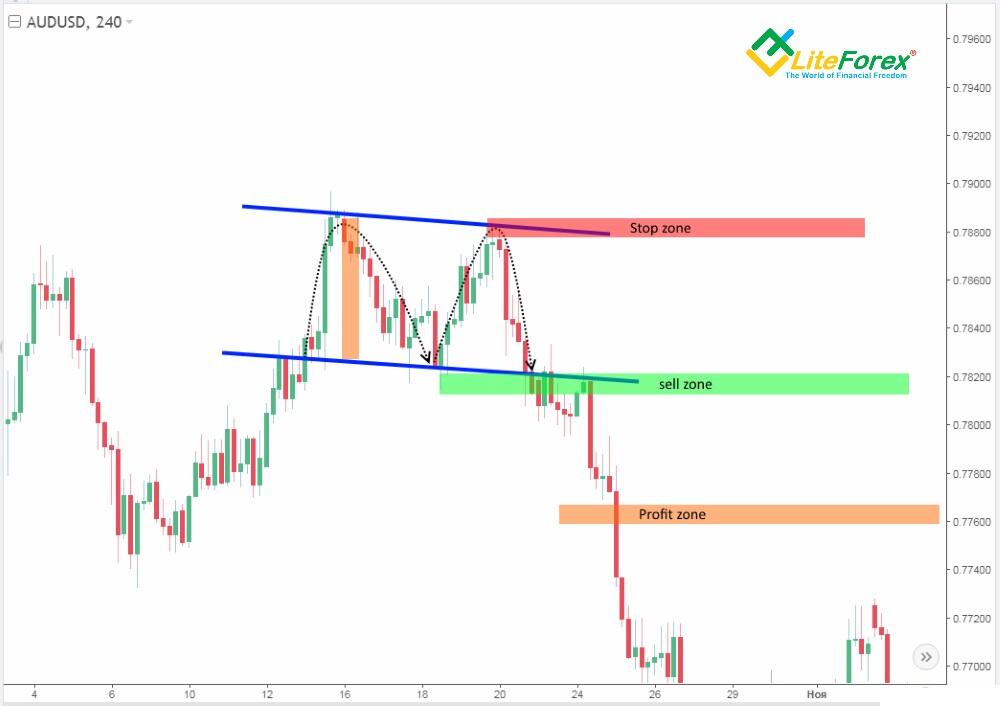
It makes sense to enter a sell trade when the price, having broken through the pattern’s support line, reaches or presses through the level of the local low, preceding the support level breakout (sell zone). The target profit should be fixed when the price covers the distance, shorter than or equal to the height of the formation’s either top (profit zone). A stop order can be placed a little higher than the local high, preceding the support line breakout (stop zone); however, you must remember that the formation often transforms into a Triple Top pattern.
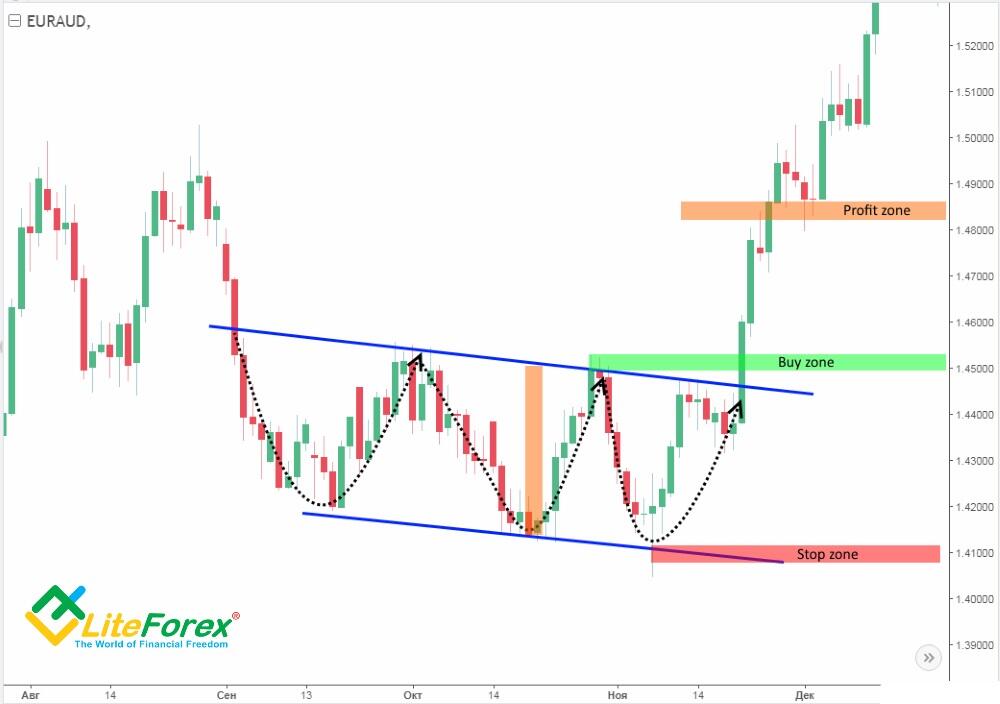
Double Bottom chart pattern
The pattern mirrors the Double Top pattern, formed in the falling financial markets. In the classical analysis a Double Bottom works out when there are reversal signals its course and the price is moving up; if the price hits the third low; the formation transforms into a Triple Bottom chart scheme.
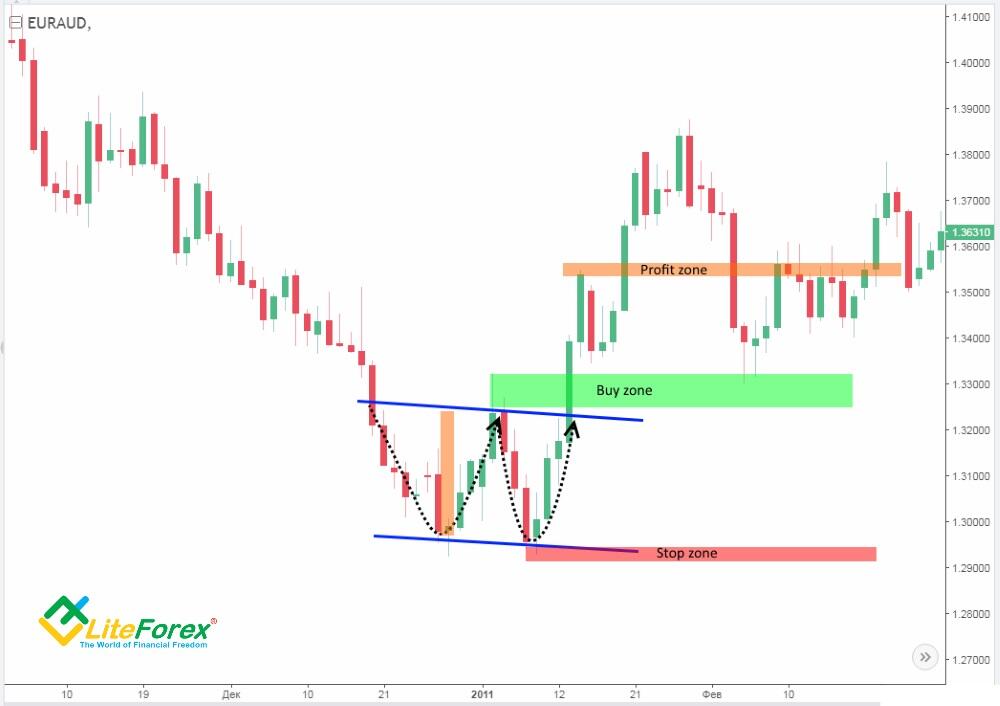
You can open a buy position when the price, having broken through the resistance levels of the formation, reaches or exceeds the local high, preceding the resistance breakout (Buy zone). The target profit is marked at a distance that is equal to the height of the pattern’s either bottom, or shorter. A reasonable stop loss can be put a few pips below the local low, preceding the resistance breakout (Stop zone). However, you must remember that the formation often transforms into a Triple Bottom; so, there are rather plenty of risks involved to put your stop loss too close to the low.
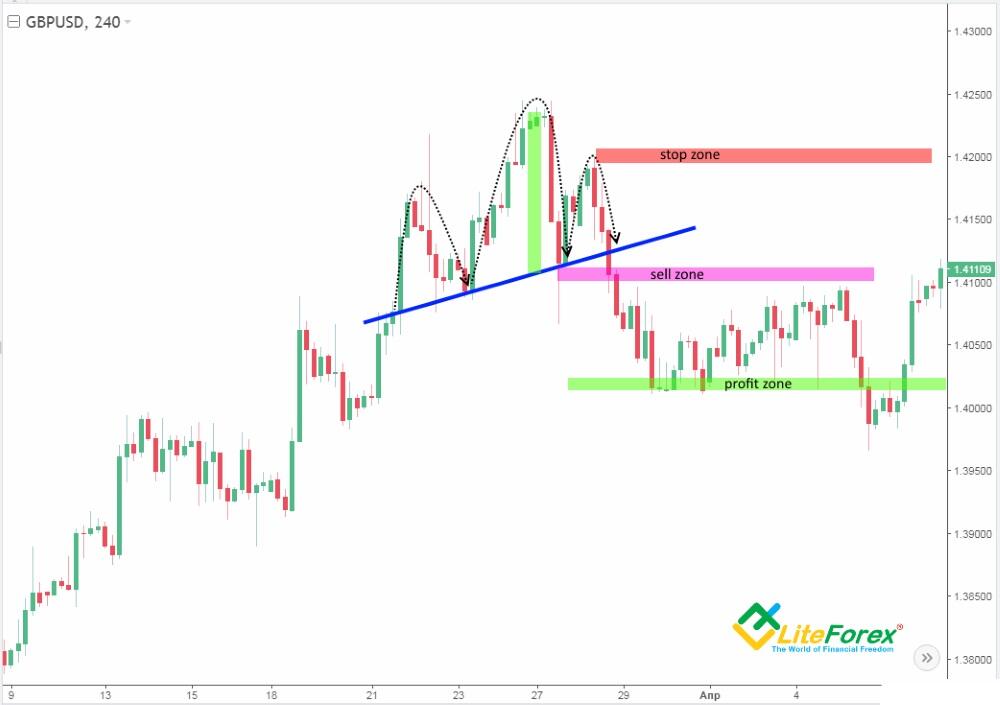
Triple Top chart pattern
The pattern is the continuation of a double top. In classical technical analysis, the Triple Top is classified as a reversal chart pattern. It means the trend, ongoing before the formation starts emerging, is about to reverse after the pattern is complete.
The pattern is formed when the price reaches three consecutive highs, the tops, located at about the same level. Most often, the pattern emerges after a failed try to implement a double top pattern, and so, it is more likely to work out than the latter one. The pattern can be both straight and sloped; in the second case, you should carefully examine the bases of the tops, which must be parallel to the peaks.
In the classical analysis, a triple top works out only if there are reversal signals and the price is heading down; if the price hits new highs, the formation transforms into either a triangle or a flag pattern.
It is reasonable to enter a sell trade when the price, having broken through the support line of the formation (the neckline), reaches or breaks through the local low, preceding the support line breakout (Sell zone). The target profit should be fixed at the distance that is shorter than or equal to the height of any top of the formation (Profit zone). A reasonable stop loss can be set around the level as high as the local high, preceding the neckline breakout (Stop zone) in order to regulate the potential risks involved in the trading.
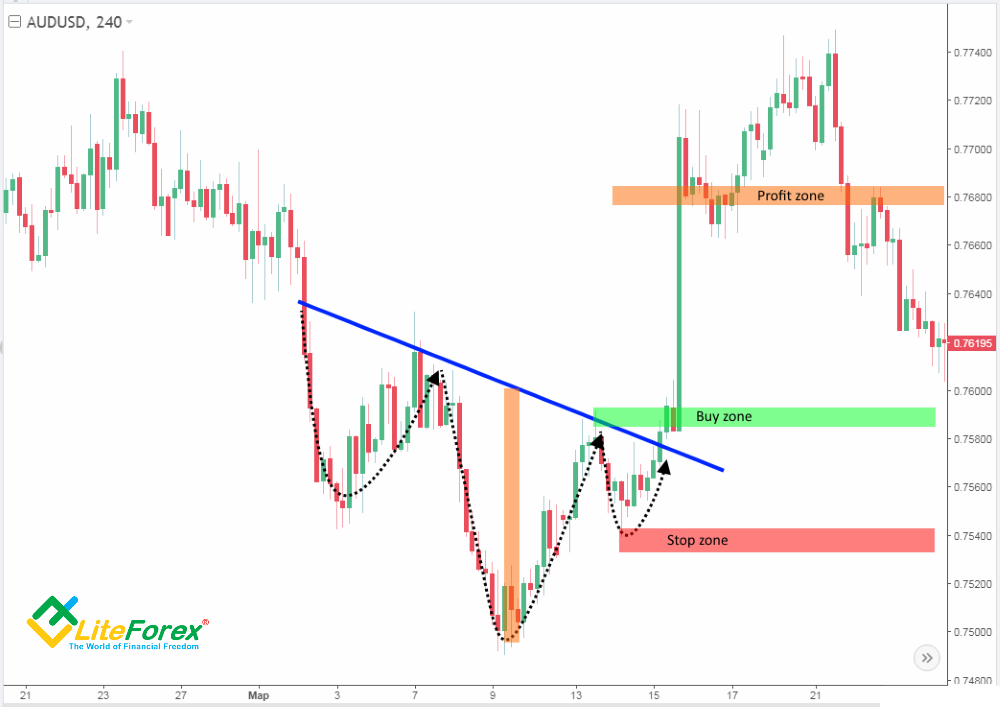
Triple Bottom chart pattern
The pattern mirrors the Triple Top, formed in the falling market.
In the classical analysis, a triple bottom works out only if there are reversal signals and the price is moving up.
You can open a buy position when the price, having moved up through the pattern resistance line (the neckline), and reaches or exceeds the local high, marked before the neckline breakout (Buy zone). The target profit can be fixed at the level that’s as high as any of the pattern’s tops or lower (Profit zone). A reasonable stop loss can be put a little lower than the local low, preceding the resistance line breakout (Stop zone).
Head and Shoulders chart pattern
The pattern is a modified version of the Triple Bottom pattern. In classical technical analysis, Head and Shoulders patterns are trend reversal chart patterns. That is, it indicates the trend, going on before the formation emerges, is likely to reverse once it is completed.
A Head and Shoulders pattern is characterized by three consecutive highs, whose peaks are at different levels: the middle peak must be the highest one (head), and the others being lower and roughly equal (shoulders patterns). However, there are some modifications of the pattern, when the shoulders are at different levels. In this case, you must make sure that the middle peak is higher than both shoulders patterns. Another key feature to identify the pattern is a clear trendline, preceding the pattern appearance.
The scheme can be both straight and sloped; in the latter case, you should be careful to check if the bases of the tops are parallel to the peaks. The lows between these peaks are connected with a trendline that is called the neckline.
Common technical analysis suggests that the pattern works out only in case of the trend reversal chart patterns; if the price is moving higher than the pattern’s peak, it is likely to be wrongly identified.
You may open a sell position when the price, having broken through the neckline, reaches or goes lower than the low, preceding the neckline breakout (Sell zone). Target profit can be put at the distance that is less than or equal to the height of the middle peak (head) of the formation (Profit zone). You may put a stop loss around the level of the local high, preceding the neckline breakout, or at the level of the right shoulder (Stop zone).
What should be added? Head and Shoulders patterns play an important part in Elliot wave analysis. It is thought that a Head and Shoulders, emerging in the chart, signals that the major cycle is coming to an end and the correction is about to start. In the chart it is often linked wave 5 and wave A.
Inverse Head and Shoulders chart pattern
The pattern is simply the inverse of the Head and Shoulders Top in the falling market with the neckline being a resistance level to watch for a breakout higher.
In the common technical analysis, the Inverse Head and Shoulders pattern works out only in case of the trend reversal upwards, that is the price growth.
You may enter a buy position when the price breaks out the neckline and reaches or exceeds the last local high, preceding the neckline breakout (Buy zone). The target profit can be put at the distance that is shorter or equal to the height of the middle peak (head) of the chart (Profit zone). A reasonable stop loss in this case can be set at the level of the local low, marked before the neckline breakout, or at the lowest level of the left shoulder (Stop zone).
Wedge chart pattern
This formation looks like a triangle, with a single, but very important difference. A triangle forms only provided there is a clear trend. That is why the pattern can work out in either side, according to the pattern direction.
In the common analysis, the rising Wedge pattern is classified in the reversal patterns.
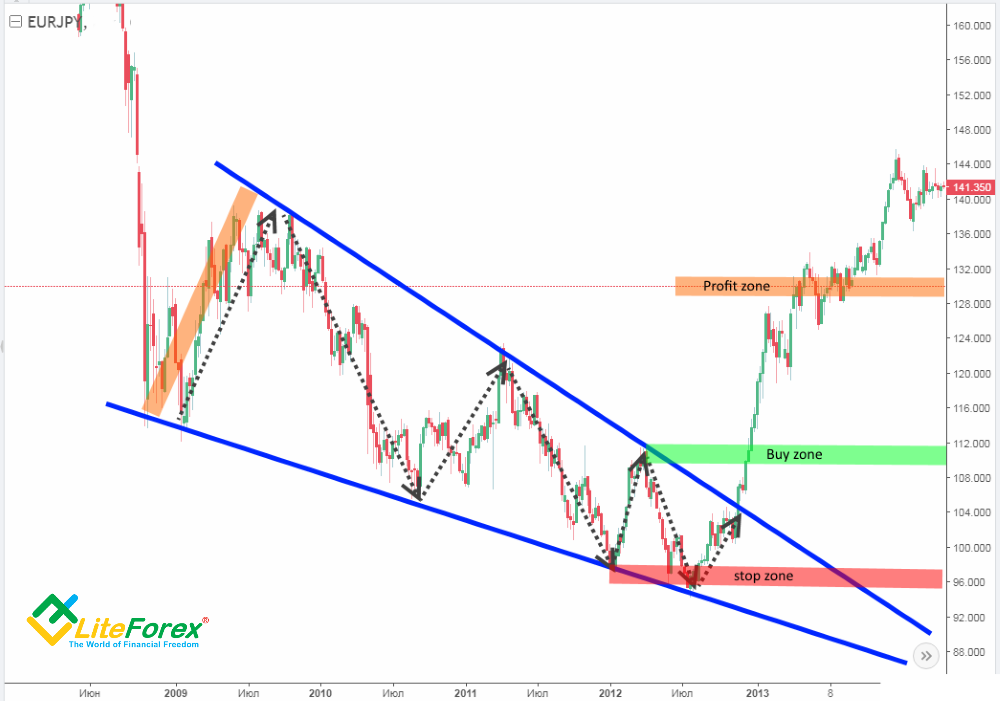
In the picture above, you can see the wedge that formed in the EURJPY price action chart not long ago.
In technical terms, the Wedge, like the Triangle, looks like a narrowing sideways channel, but the Wedge and the Triangle also differ in size. The Wedge is, as a rule, much bigger than the Triangle, and it can take months and even years to complete the formation.
So, in the classical analysis, the falling or rising Wedges, as a rule, signal that the price is likely to move in the direction, opposite to the scheme; in other words, the ongoing trend is about to change its course.
It is reasonable to place a buy order when the price, having broken out the resistance line, reaches or exceeds the last local high, preceding the resistance breakout (Buy zone). Sometimes, you may lose about 3% of the price movement between the point of the resistance breakout and your entry. Target profit can be put at the distance, equal to or less than the breadth of the pattern’s first wave. A reasonable stop loss can be placed at the level of the local low, marked before the resistance breakout (stop zone).
What should be added? In technical analysis, there are a few rules to identify the rising Wedge pattern, which are worth observing:
1) The Wedge, as a rule, may be broken out at waves 4, 6 and each successive wave with even number. The first wave for the Wedge, like for the Triangle, is the movement that started the pattern’s developing, that is, in the direction of the ongoing trend.
2) The Wedge can be usually broken out only when the price has entered the last third of the formation. To figure it out, divide hypothetically the entire expected rising wedge pattern into three equal intervals; you’ll need the interval, where the support and resistance levels have met.
Flag chart pattern
This Flag chart pattern is one of the simplest short-term chart patterns; so, its efficiency depends on numerous factors and is considered as an easy to handle pattern.
In the common technical analysis, the Flag scheme is classified as a continuation pattern. Therefore, it signals the trend, prevailing before the pattern has emerged, is likely to continue once the formation is completed.
The trend indicates a corrective rollback, following the strong directed movement that often looks like a channel, sloped against the prevailing trend.
In the classical technical analysis, the Flag chart scheme can result only in the trend continuation.

In the picture above, you can see a Flag, sloped down, which indicates that the price is about to head upwards.
It makes sense to enter a purchase when the price, having broken out the pattern’s resistance line, reaches or exceeds the local high, marked before the resistance breakout (Buy zone). The target profit should be set at the distance, not longer than the trend, developing before the pattern emerged (Profit zone). A stop order may be put at the level of the local low, preceding the resistance breakout (Stop zone).
What should be added? Technical analysis suggests a few rules to identify a Flag pattern correctly.
1) The angle between the Flag channel and the prevailing trend mustn’t be wider than 90 degrees.
2) The Flag channel itself mustn’t go lower/higher than a half of the preceding trend.
Pennant chart pattern
This chart pattern is a modification of the Flag, so it has the same major features.
In the common technical analysis, the Pennant pattern is classified as a continuation pattern. Therefore, it signals the trend, prevailing before the pattern has emerged, is likely to continue once the formation is completed.
This chart pattern indicates a corrective rollback, following the strong directed movement that often looks like a small triangle, sloped against the prevailing trend. A pennant in the longer timeframe is often a triangle in the short-term chart.
In the classical technical analysis, the Pennant chart pattern can result only in the trend continuation.
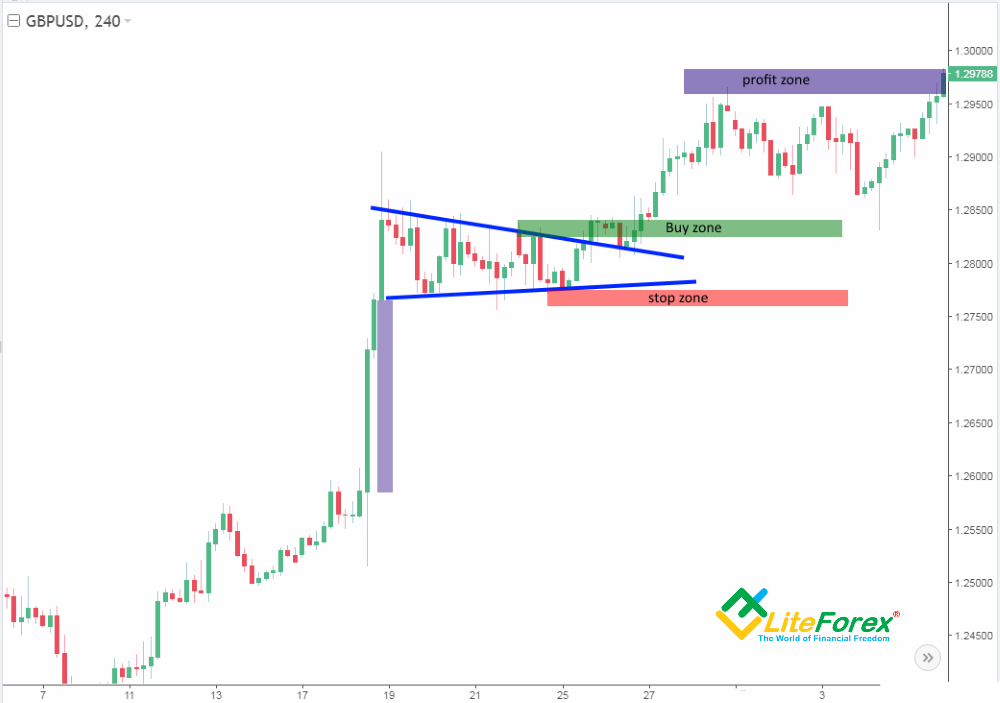
It makes sense to enter a purchase when the price, having broken out the pattern’s resistance line, reaches or exceeds the local high, marked before the resistance breakout (Buy zone). The target profit should be set at the distance, equal to or shorter than the trend, developing before it emerges (Profit zone). A stop order may be put at the level of the local low, preceding the resistance breakout (Stop zone).
Broadening Formation pattern (megaphone pattern)
The Broadening Formation, also known as a megaphone pattern, looks like a megaphone or a reverse symmetrical triangle. Therefore, its work principles are similar to the triangle’s ones. In classical technical analysis, a broadening formation is classified as a continuation pattern, though it is most often an independent trend. It means that the trend, prevailing before the formation started, is likely to resume once it is completed.
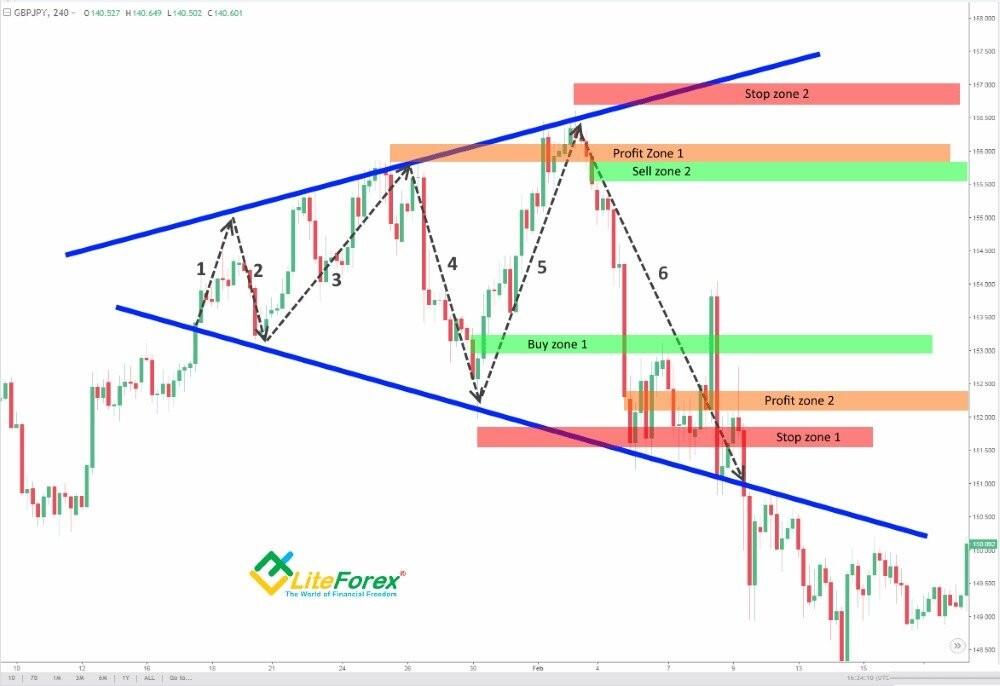
One of the forms of the Broadening Formation is displayed in the picture above.
In technical terms, the formation looks like a broadening sideways channel that can sometimes be sloped. The pattern’s realization is based on the fact that the price in each new local trend marks new highs and lows; so you trade the trend to spot the price inside the formation, rather than to expect a breakout of the swings range, like it was described for symmetrical triangles.
So, let’s see the examples of entry orders inside the pattern.
The formation, like a triangle, has waves inside; and they are, like in a triangle, the price moves up and down, from the high to the low.
A reasonable buy entry can be placed when the price, having reached the support level of the line, reaches or breaks through the local low, previous to the current low (buy zone 1). The target profit can be set at the level of the local high, followed by the current one, or higher (profit zone 1). A reasonable stop loss can be placed a little lower than the low, after which you entered the trade (stop zone 1).
It makes some sense to enter a sell trade when the price, having hit the resistance levels of the formation, reaches or exceeds the local high, followed by the current high (Sell zone 2). The target profit should be set at the level of the local low or lower (profit zone 2). A stop order in this case may be put higher than the local high, following which you entered the trade (stop zone 2).
What should be added? There are a few simple rules to correctly identify a Broadening Formation pattern and avoid common mistakes:
1. You should start trading inside the pattern only after wave 4 of the pattern is completed.
2. Positions in the trend direction, prevailing before the pattern started developing, are safer and are more often to reach the target profit.
3. You should put stop orders not only beyond the local lows or highs, but it also good to place them beyond the support and resistance levels of the formation, in case of false breakouts of the lines.
Diamond chart pattern
This formation is a combination of the Triangle and the Broadening Formation
In the common technical analysis, the Diamond is classified in the reversal patterns, and it is often a distorted modification of the Head and Shoulders pattern.
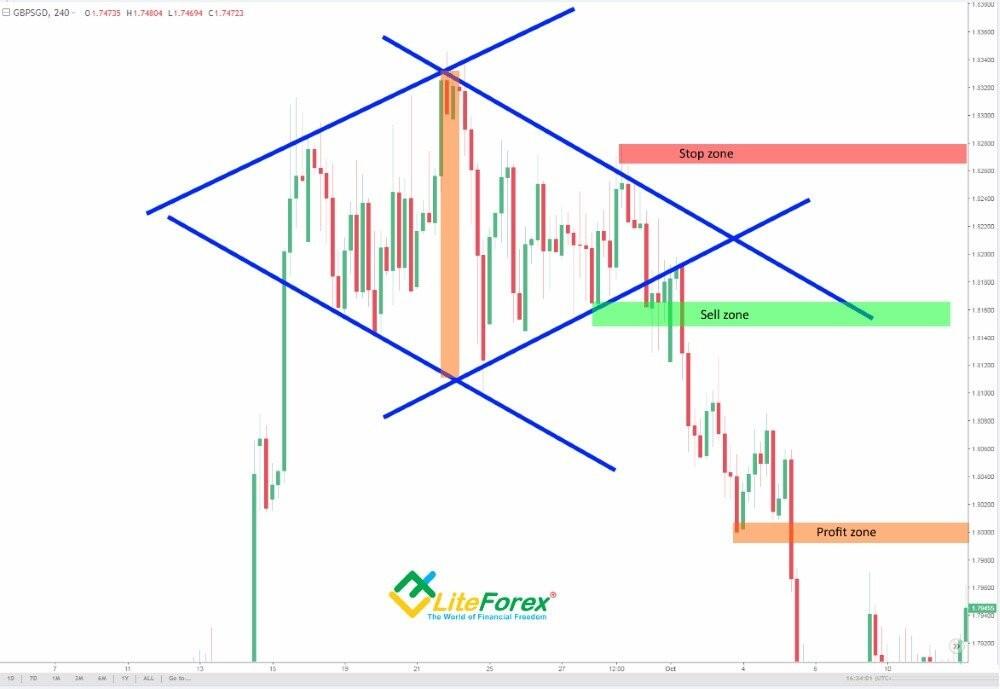
You enter a sell trade when the price, having passed down through the pattern support line, reaches or breaks through the local low, followed by the support breakout (Sell zone). The target profit is set at the distance equal to or shorter than the width of the biggest wave inside the pattern (Profit zone). A reasonable stop loss here will be at the local high, preceding the support line breakout (stop zone).
What can be added? There are some simple rules that will help you trade the Diamond pattern more efficiently and avoid common mistakes:
1. The pattern can seldom result in the trend continuation. In this case, you can simply trade with pending orders, or be careful to check that the pattern’s support and resistance lines are parallel to each other.
2. The most productive is the pattern, whose biggest wave is formed by a single candlestick, and the high and the low are the candlestick shadows.
3. The Diamond pattern most often appears at the end of long trends, so, you’d better look for it in the timeframes, starting from 4H and longer.
Spike pattern
A spike is a comparatively large upward or downward movement of a price in a short period of time.
The pattern usually emerges, following the state balance between supply and demand in the market.
In common technical analysis, the Spike is referred to as a type of the reversal patterns.
The chart patterns start emerging when a sharp local trend ends; the movements start slowing down and there occurs a sharp surge in volume in a thin market. This volume is instantly offset. At this point, there are two likely scenarios. First, buyer or seller, who was trying to break the flat, can just remove the volume from the market and the price will go back. Second, a bigger trade volume in the opposite direction is put against the volume of the first trader and returns the price to the former levels.
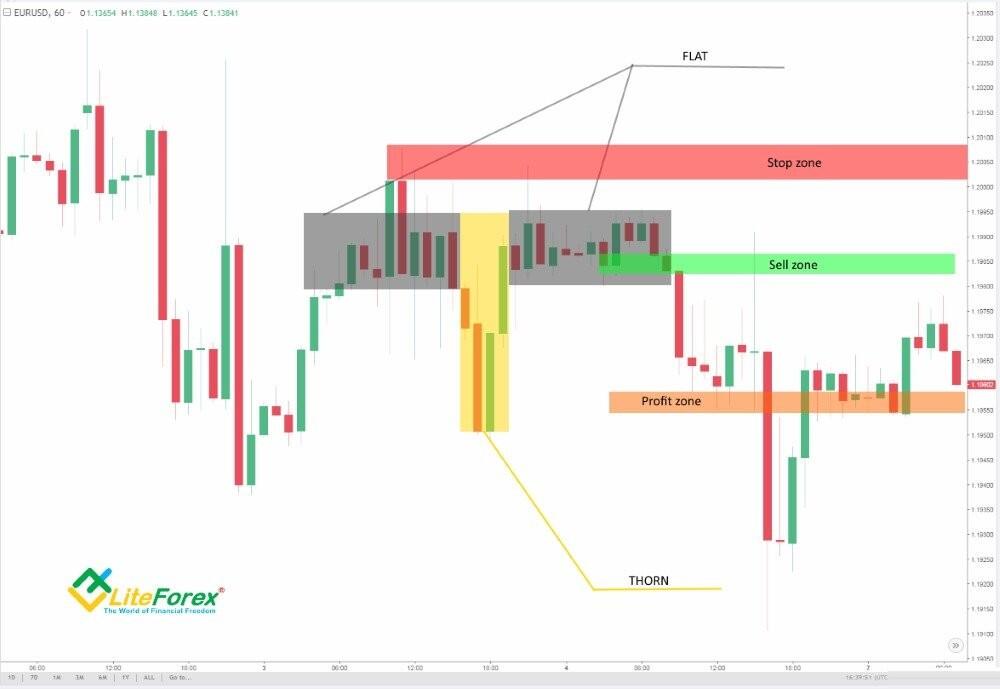
You might enter a sell trade when the price goes out of the sideways trend after the major pattern works out (Sell zone). The target profit here should be put at the distance shorter than or equal to the spike’s height (Profit zone). A reasonable stop loss can be put a little higher than the local highs of the sideways trend, marked before and after the spike (Stop zone).
What can be added? There is a number of rules that will help you trade the Diamond pattern more efficiently and avoid common mistakes:
- Before and after a spike emerges, there must be short-term sideways trends (flats).
- Before the first flat starts, there must be a strong, clear trend that ends with the trend.
- The pattern is the most efficient when the spike of the formation is made of just two candles, and it is good when it is in the timeframe, longer than H1.
I will go on the review with chart formations, resulting from Japanese candlestick charting techniques.
Volume candlestick pattern
It is a candlestick pattern that consists of just a single candle.
The pattern looks like a candle with a very small body and very long tails (wicks). The candlestick is called volume candle because it emerges when there are large trade volumes in the opposite directions in the market. Therefore, by the time of closing, the market hasn’t yet determined the new trend, as the demand and the supply are almost equal. However, the balance can’t last for a long time, and either buyer or seller finally wins, driving the price in the corresponding direction. The price should soon break through the low or the high of the volume candlestick, sending us a signal to enter a trade and work out the pattern.
You can seldom come across the trend in classical technical analysis, as it was discovered as early as in the 1990s, and is hardly remembered nowadays. So, in the present interpretation, the formation is rather a proprietary scheme, and I have figured out and repeatedly tested all the orders’ levels myself.
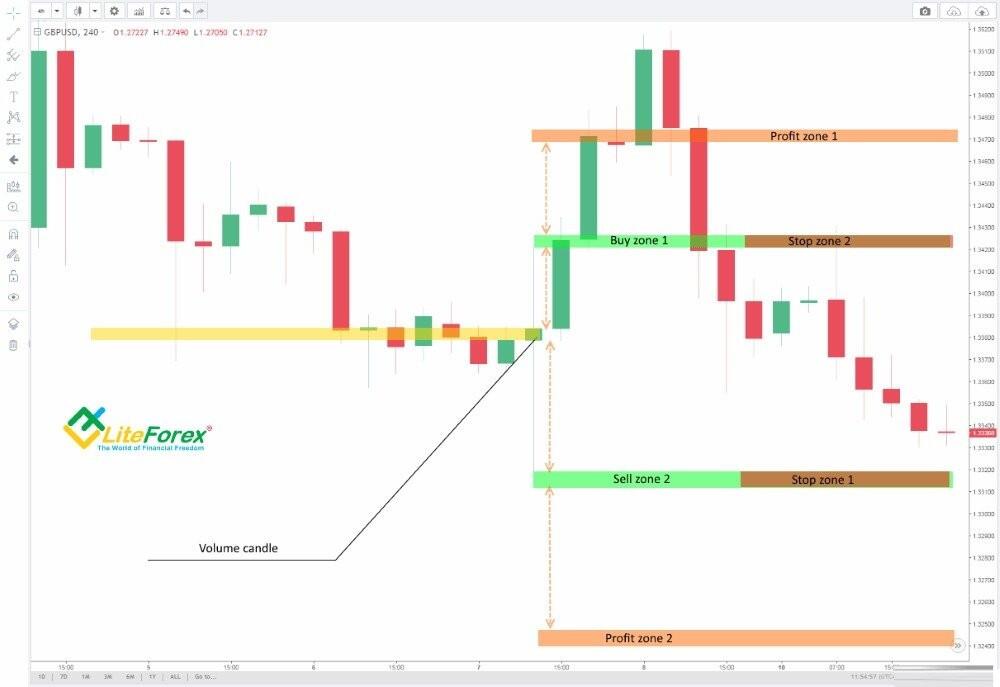
According to the pattern, you can enter trades in either direction, mostly by means of pending orders Buy Stop and Sell Stop.
You open a sell position when the price reaches or goes lower than the local low of the volume candlestick (Sell zone 2). Target profit is put at the distance shorter than or equal to the distance between the candlestick open price and its low (Profit zone 2). A stop loss in this case can be set at the local high of the volume candle (Stop zone 2).
You enter a buy trade when the price reaches or exceeds the local high of the volume candlestick (Buy zone 1). Target profit is put at the distance shorter than or equal to the distance between the candlestick close price and its high (Profit zone 1). A reasonable stop loss can be set at the local low of the volume candle (Stop zone 2).
What should be added? There is a number of rules that will help you trade the pattern more efficiently and avoid common mistakes:
1. The candlestick body should be at least tenfold less than its total length from the low to the high.
2. Each tail shouldn’t be shorter than 400 pips
3. This strategy works only in two timeframes — H4 and D1.
Tower chart pattern
The Tower pattern is a candlestick formation that consists of 6 and more candles.
The Tower is commonly referred to as a reversal scheme and most often emerges at the end of a trend.
The Tower, as a rule, consists of one big trend candlestick, followed by a series of corrective bars, having roughly equally-sized bodies. After a series of corrective candlesticks is completed, there is a sharp movement via one or two bars in the direction, opposite to the first trend candlestick.
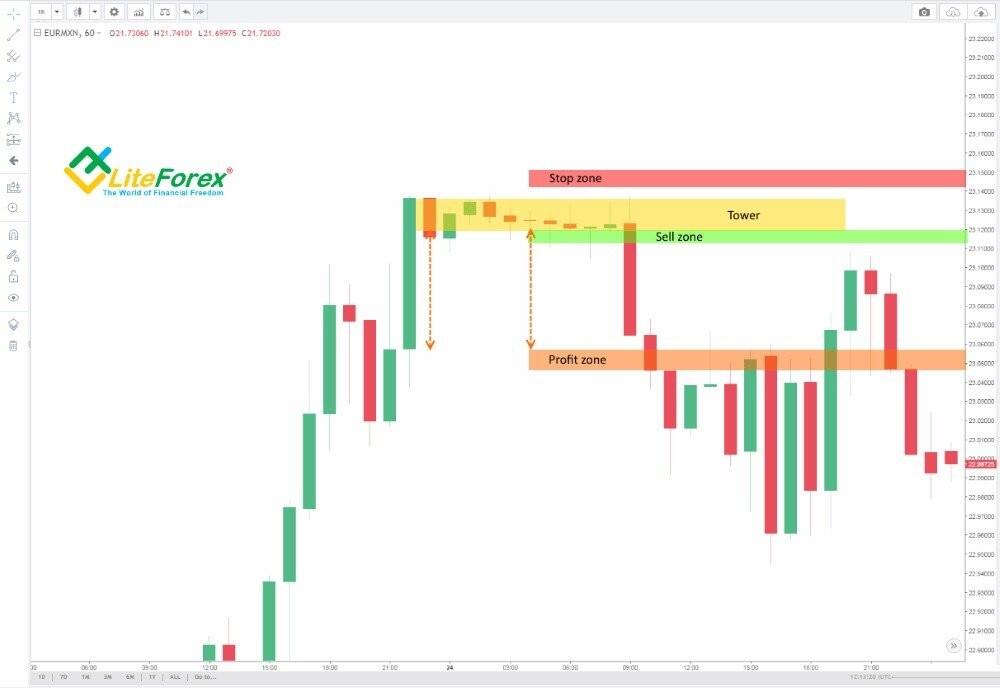
You put a sell entry when there starts emerging bar 5 and all the next bars of the correction (Sell zone). Target profit is put at the distance, not longer than the height of the first pattern’s candlestick (Profit zone). A stop loss may be set at little higher than the local highs of the sideways corrective movement (Stop zone).
What should I add? There are some rules you need to follow to increase the pattern’s efficiency and avoid common mistakes.
1. In the picture, there is one of the ways, how pattern can develop. Perfectly, the pattern should consist of 5-6 bars (1 candle of the trend, 4 bars of the correction, and 1 bar of the work-out).
2. The pattern usually works out via the fifth corrective bar, but there are some Towers that include more corrective bars. In this case, you stick to the general rules and enter the working out via the fifth bar.
3. Don’t put a stop order too close to the local highs/lows of the correction; it can be just triggered by the market noise.
Three Crows pattern (Three Buddhas)
The pattern is a candlestick formation that consists of 4 candlesticks; when you switch to a shorter timeframe, it can often look like a Flag pattern.
The Three Crows pattern is commonly classified as a continuation scheme; therefore, it is often a kind of the zigzag correction.
The pattern usually comprises one big trend candlestick, followed by three corrective candles with strictly equal bodies. The candles must be arranged in the same direction of the prevailing trend and be of the same color. After the series of corrective candles is completed, the market explodes via one or two long candlesticks in the direction of the prevailing trend, indicated by the first candlestick.
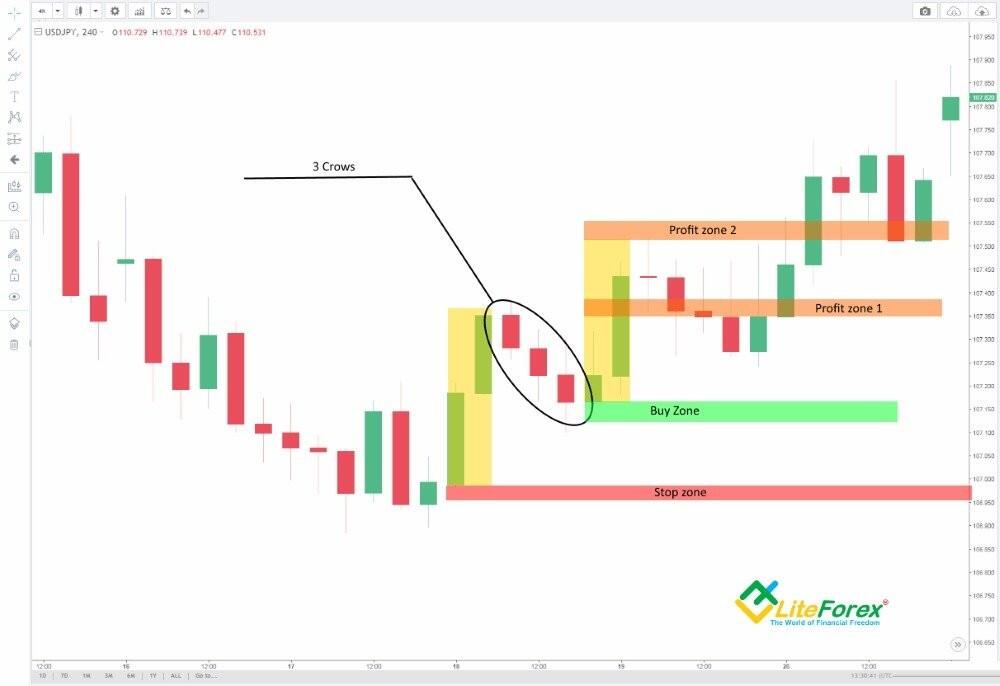
You open a buy position, when the third candle of the correction closes and the fourth one opens (Buy zone). Target profit can be put in two ways. The common rule suggests you set target profit at the distance that is less than or equal to the length of the first candlestick in the pattern (trend candlestick) (Profit zone 2). The second way suggests you take the profit when the price reaches the level of the longest upper tail of any candlestick in the pattern (Profit zone 1). A reasonable stop loss in this case can be put at the local low of the correction candle 3 (Stop zone).
What should be added? There is a number of rules that will help you trade the pattern more efficiently and avoid common mistakes:
1. The first candlestick (leg) cannot consist of more than 2 candles; it is perfect, if there is only one candle, of course.
2. Correction candlestick must have equally-sized bodies, the tail length is not important.
3. The body of the third correction candlestick mustn’t go higher/ lower than a half of the first candlestick in the pattern
Cube pattern (Golden Cube)
The pattern consists of 4 candles, and it often looks like a sideways trend, flat, in the shorter timeframe.
In common technical analysis, the Cube is classified as a continuation pattern, but it is most often a kind of the correction pattern, “flat waves”.
The Cube consists, as a rule, of 4 consecutive candlesticks of equal size and alternating colors. Candles must be long enough to construct a geometrical object “Cube”. It is also known as a Golden Cube, as 90% of the chart patterns alike occur in the XAUUSD price chart. It is quite simple to trade the pattern: when candlestick 5 opens, following four consecutive ones of equal size, you enter a trade, based on the color of the first candlestick in the chart. If it is red (black), you enter a sell; if it is green (white), you enter a buy.
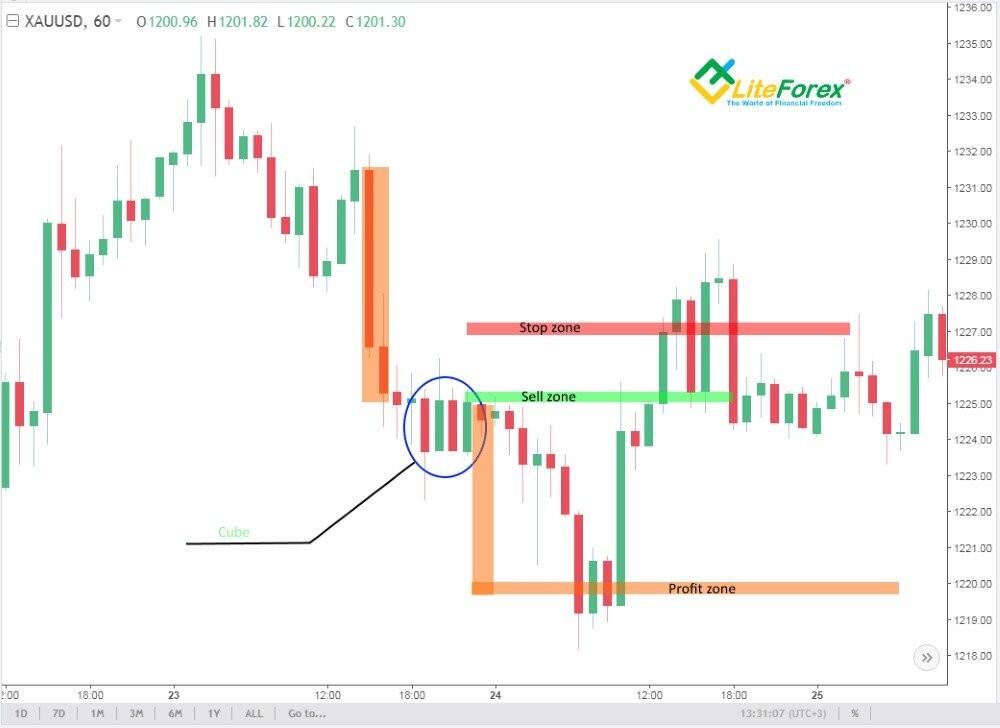
You put a sell order when there opens candlestick 5, following four candles of the cube (Sell zone).Target profit can be put at a distance that is not longer than the trend, prevailing in the market before it emerges (Profit zone). A stop loss in this case may be put at the distance, equal to the length of any cube’s candlestick, in the opposite direction of your entry (Stop zone).
What should be added? There is a number of rules that will help you trade the pattern more efficiently and avoid common mistakes:
- If the candlesticks are long and don’t construct a cube together, it is rather a rectangle, than a cube, and you shouldn’t trade according to the pattern.
- The tails of the candlesticks in the pattern don’t influence the pattern’s efficiency.
- The best timeframe to trade the pattern is H4.
Tweezers pattern
The pattern is a candlestick formation that consists of two or more candlesticks, which have long equal tails (wicks).
The Tweezers formation is commonly thought to be a reversal pattern that most often appears when the trend ends.
A Tweezers pattern usually consists of two or more candles, whose tails are at the same level. In addition, a tail must be as long as at least a half of the candle’s body. Tweezers, made of two candles, are the most often. The formation is a common reversal pattern and emerges quite often in the market; therefore it strongly depends on the timeframe where it is identified.
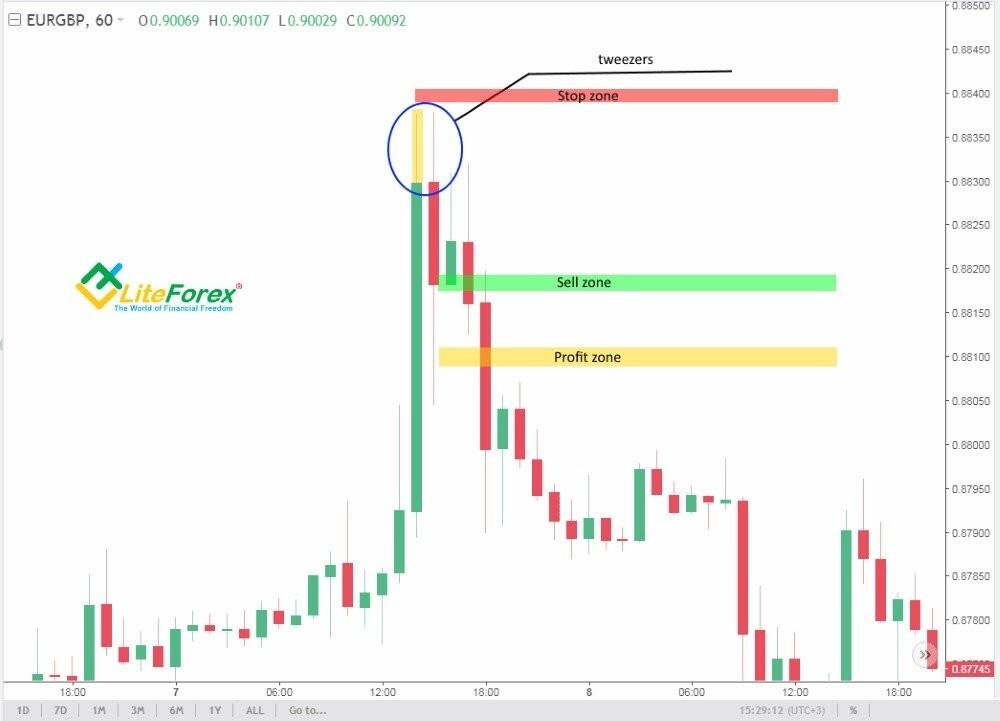
You enter a sell trade when the last candlestick of the pattern (it is usually the second one) is completed, and a new candlestick starts constructing (Sell zone). Target profit is placed at the distance, not longer than one of the tails (wicks) of the candles, comprising the pattern (Sell zone). A reasonable stop loss may be put a few pips above the local highs, marked by the candles, constructing the pattern (Stop zone).
What should be added? There is a number of rules that will help you trade the pattern more efficiently and avoid common mistakes:
- In the common form, the pattern consists of two candles, but you can come across Tweezers, made up of three or more candles. In this case, a stop loss should be set at an ample distance, much higher than the tails.
- If the tails of the adjacent candles don’t end at the same levels, but with a slight difference, you’d better not enter a trade, based on the pattern.
- Target profit for this pattern is sometimes placed at the distance, equal to or shorter than the longest candle in the pattern.
Gap pattern (Gapping play)
This pattern is not a real pattern; it is rather a trading strategy, based on exploiting the price gap.
The trading strategy is based on the idea that there are two types of price gaps in the modern market. The first one usually happens when there is a break in trading on an exchange; the second one results from fundamental factors, affecting the market. This methodology suggests exploiting the second type of gaps, that is, the gaps emerging during trading sessions. Statistically, it is thought that most of the financial instruments that gap at the opening often move back towards the previous levels before trading resumes in the usual mode. In other words, the price gap is seen not as the emerging of the new trend, but rather as a short-term response of the speculators to a certain event that is likely to be instantly played by the market.
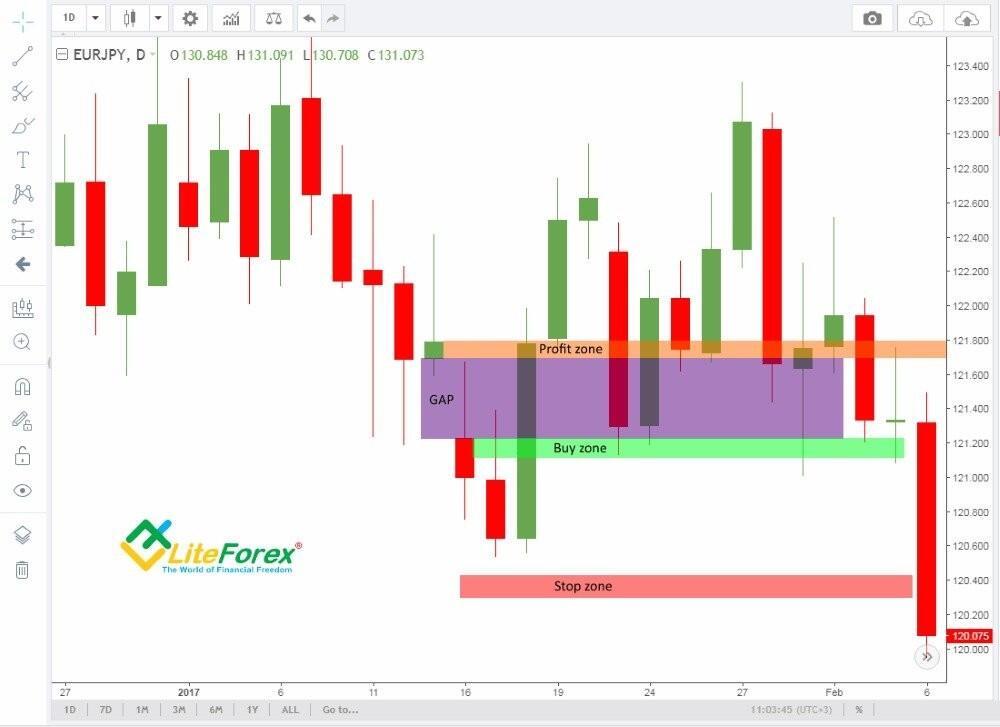
You open a buy position after the first candlestick, following the price gap, opens (Buy zone). Target profit is set at the distance that’s equal to or shorter than the gap itself; in other words you take the profit when the price rolls back to the previous close, preceding the gap (Profit zone). A stop loss can be put at the distance, equal to or longer than the gap in the direction, opposite to your entry (Stop zone).
What should be added? There is a number of rules that will help you trade the pattern more efficiently and avoid common mistakes:
- It is quite easy to distinguish between the needed type of gap and the one, resulted from a break in the exchange work. The second kind of gaps happens at a particular time, determined by the exchange working hours; gaps, occurring at a different time, are simply ignored.
- The needed gap most often happens in the intraday timeframes; that is, in the intervals, starting from H1 and shorter.
- It makes no sense to set a stop loss less than the target profit; you’d better put it at an ample distance.
Mount pattern
The formation is a rather rare proprietary pattern, but it often works out successfully. The pattern looks like Three Crows pattern, I’ve already described, but inverted.
The Mount pattern is commonly thought to be a reversal pattern, unlike the Three Crows that is a continuation one.
The Mount usually consists of one long trending candlestick, followed by three little candles of the same color as the main candlestick; that is the signal the continuation of the trend, indicated by the big candle. The little candles usually have bodies of equal sizes. The candles must follow each other, sloped in the direction of the main trend. After the series of small candles is completed, there is a sharp price jump via one or two candles in the direction, opposite to the first candlestick in the scheme.
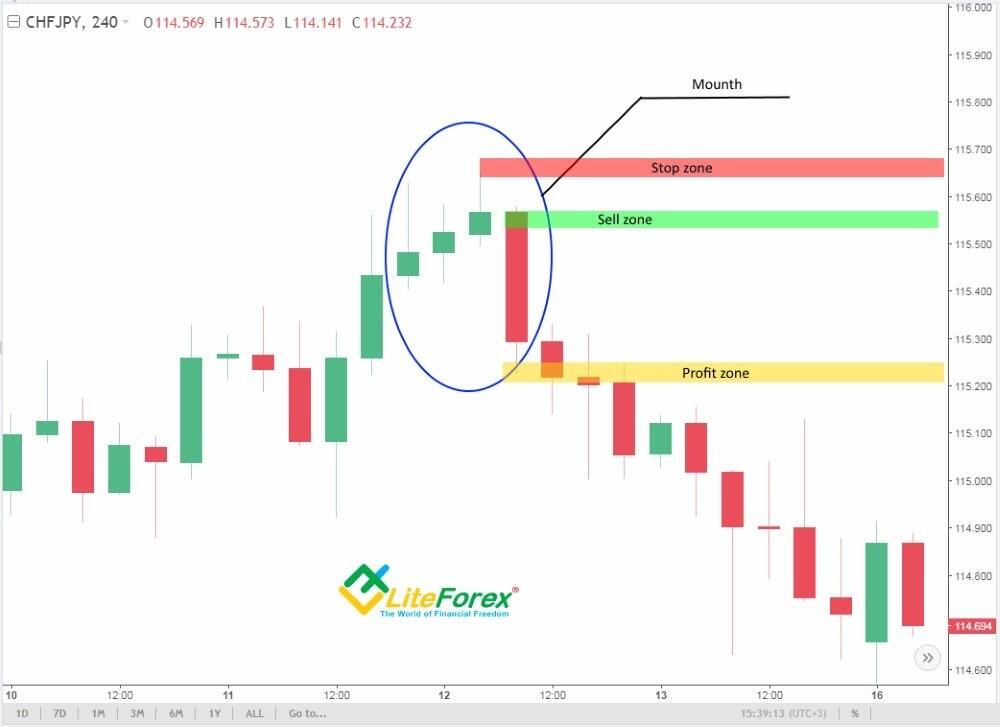
You enter a sell trade when there is emerging the first candlestick, following the three little ones (Sell zone). Target profit is placed at the distance that is not longer than the total length of the three little candles and one big candlestick of the prevailing trend (Profit zone). A reasonable stop loss here is set a few pips above the local high of the longest candlestick in the pattern (Stop zone).
What can I add? There are a few rules, following which you will trade the pattern more efficiently and avoid common mistakes:
- As a rule, the final entry candlestick must be much longer than the three preceding candles and engulf them.
- The trend most often occurs in the H4 timeframe.
- Target profit is sometimes set at the level of the trend beginning just ahead the scheme itself.
Symmetrical Channel pattern
The formation is a price pattern that is being constructed for a long time.
The pattern represents two trends that are basically corrective to each other. The trends are usually of equal length and time of development. The trends are most often displayed like two clear price channels. Trading the scheme is based on the idea that the trend, prevailing before the channels started developing, will be resumed by the price once the channels are completed.
In the classical analysis, the formation is a reversal pattern; but, because it is often very big, it is rather an independent trend than a part of some other one.
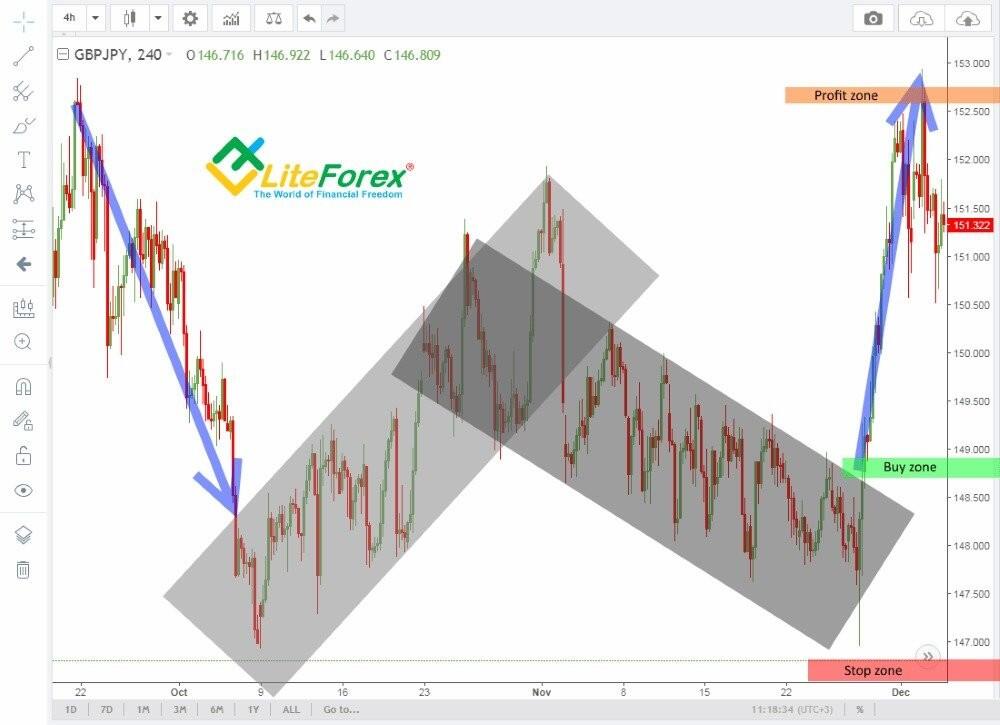
You open a buy position when the price breaks through the resistance line of the second channel and reaches the local high, preceding the breakout (Buy zone). Target profit may be taken when the price covers the distance equal to or shorter than the trend, prevailing before the first channel starts emerging (Profit zone). A stop loss is reasonable to set at the local low inside the second channel, which was marked before the channel’s resistance had been broken out (Stop zone).
What should be added? There is a number of rules that will help you trade the pattern more efficiently and avoid common mistakes:
- As the pattern represents an independent trend, you’d better look for it in the timeframes, not shorter than D1.
- The pattern is often identified long before the second channel is completed, so you can trade inside the channel.
- So far, there have been recorded no cases when the pattern hasn’t worked out in the expected way; so there is no need to set stop losses, and so it makes the order less likely to be triggered by the market noise.
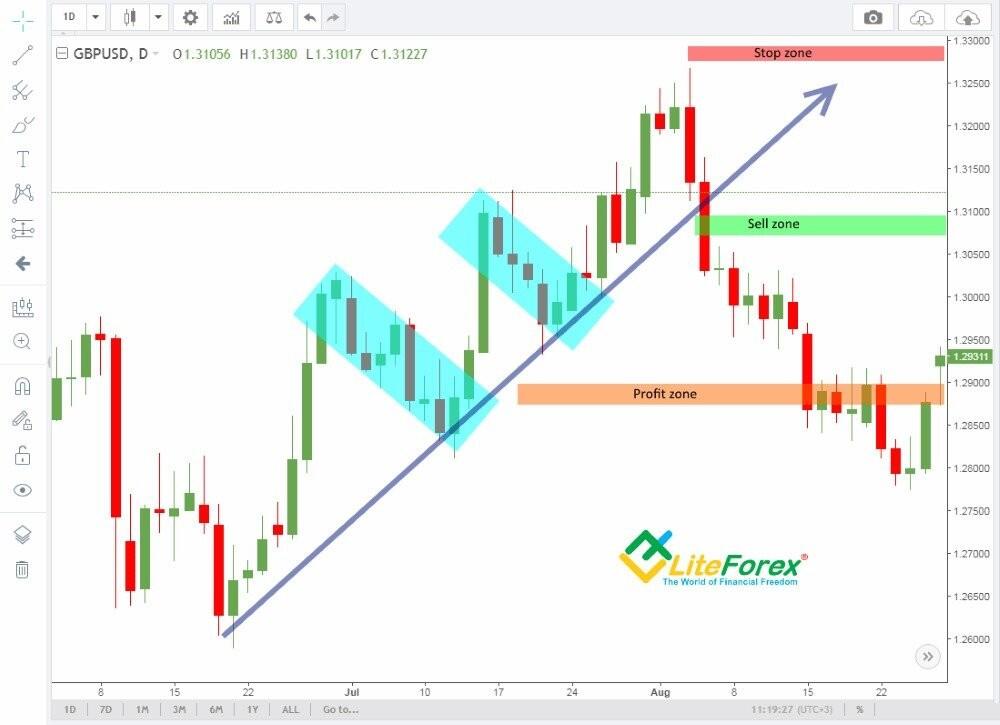
Three Stair Steps pattern
The formation is a classical reversal pattern.
The pattern represents one of the main trend scenarios in technical analysis. It consists of three momentums, followed by the market reversal and the correction, once they are completed. In fact, the stairs in the pattern describe the local corrective price rollbacks, after the movements in the main trend; and the third stair is already the start of the global corrective movement, which determines the pattern’s realization.
The trend is traded according to one of the basic concepts of the trend reversal chart patterns. If the trend is formed by two stairs, as it is displayed in the picture below, the pattern is thought to be complete. In this case, you need to expect the first stage of reversal patterns that usually start when the global trendline is broken through (the support line). The movement from the ongoing trend’s high down to the support line breakout is the third stair of the pattern.
What should be added? There is a number of rules that will help you trade the pattern more efficiently and avoid common mistakes:
- The pattern is basically a part of the cycle in the wave theory; therefore the target profit should be calculated according to the basic method of the wave theory – Fibonacci levels.
- In some cases, when the pattern is complete in the long timeframes, it is reasonable to stay on the safe side and enter a trade after the price reaches the local high/low, following the breakout.
- The stairs of the pattern are often the local Flags; so you can trade them within the global Three Stair Steps pattern.
Flat Breakout pattern
The formation is rather a way to trade the price channel than an independent scheme of technical analysis. It is classified as a pattern because it steadily works out and is quite efficient.
The pattern looks like a common sideways channel that is often sloped. The channel is formed according to the price moving up and down, “from border to border”. The price movements inside the channel are called the “channel’s waves”. The scheme is based on the idea that its last wave is 50% of the basic length of the channel. You draw a hypothetical line that divides the channel into two equal parts and expect the movement that will rebound from this line, rather than break it through as a common wave. After the price rebounded from this hypothetical line, you need to wait until the price breaks through one of the channel’s borders and enter a trade in the direction of the breakout at the distance of the base channel breadth.
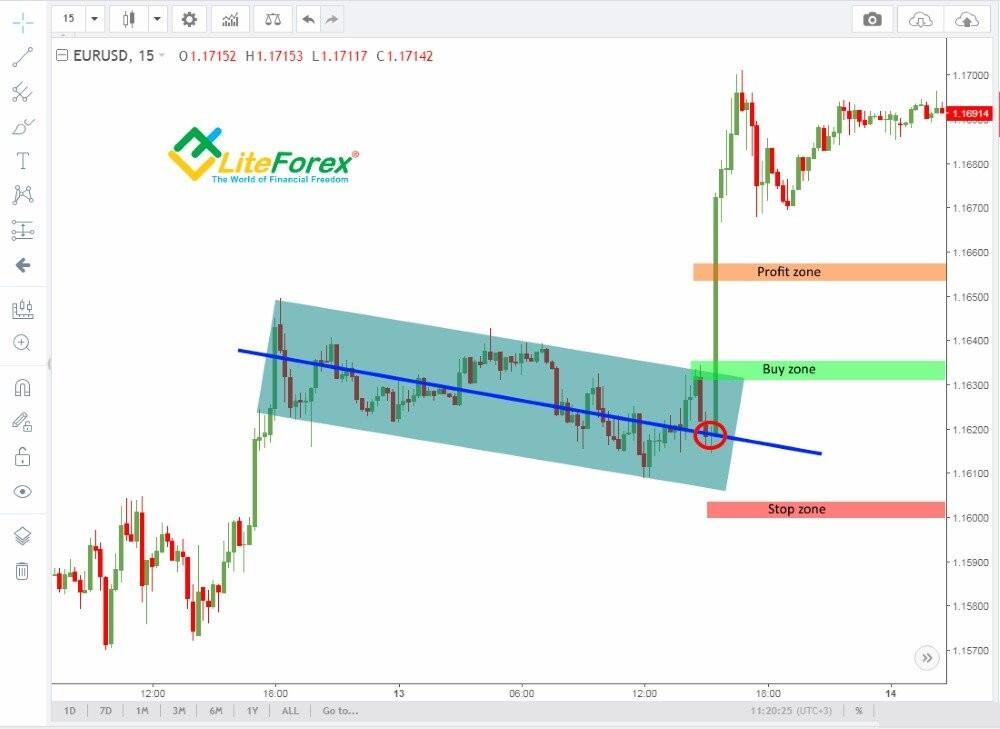
You open a buy position when the price, having rebounded from the hypothetical middle line, breaks through the channel’s resistance line and reaches or exceeds the last local high of the channel (Buy zone). The target profit can be taken when the price covers the distance that is shorter than or equal to the breadth of the broken channel (Profit zone). A stop loss can be placed a few pips below the last local low inside the broken out channel, (Stop zone).
What should be added? There is a number of rules that will help you trade the pattern more efficiently and avoid common mistakes:
- This pattern of channel breakout is quite simple and often occurs; but it is difficult to identify it, as it most often emerges in short timeframes.
- If the price breaks through the channel’s middle line by its tail that reaches the opposite border of the channel, but the body of this candle doesn’t break out the center line, the movement is considered to be a wave and it isn’t exploited to realize the motive.
- When you set stop losses, you should take market noise factor into consideration; therefore, you shouldn’t enter the trades where stop loss and take profit are less than the average market noise for the financial instrument traded.
Patterns for Cryptocurrency trading
Conclusion
In conclusion, I’d like to note that all price charts of technical analysis in Forex market are not rigid laws and can be interpreted in different ways. However, the longer is the timeframe, where you are looking for a scheme, the more likely is the way to work out.
In conclusion, I’d like to note that all price charts of technical analysis in Forex market are not rigid laws and can be interpreted in different ways. However, the longer is the timeframe, where you are looking for a scheme, the more likely is the way to work out.
Nowadays, there are over a hundred patterns, officially described and recorded in the register of technical analysis; and new ones appear every day. If you managed to discover and define your own scheme in the chart, don’t abandon it just because it hasn’t been described before. You may have discovered a new scheme that will yield you profits. And the fact that it is known only to you, is, in fact, an advantage; for market makers won’t use it to get careless traders into a trap. To sum it up, don’t be afraid to enrich your Forex trading tools with something new; for the best market analyst is you, yourself.